
Showing posts with label short selling. Show all posts

Friday, September 19, 2008

Puts Instead of Shorts?

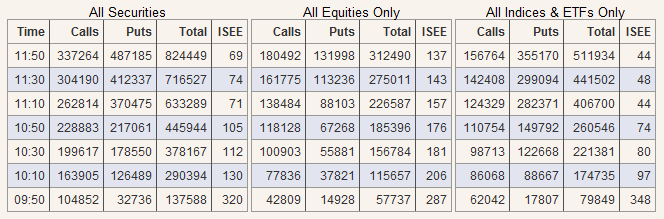
The table below shows call and put activity at the International Securities Exchange (ISE) during the first two hours of today’s trading. Keep in mind that the ISEE is a “call to put” ratio, not the “put to call” ratio reported by the CBOE.

As reflected in the table, right out of the gate there was a flood of calls for indices, ETFs, and individual stocks. Note that in the last hour or so, the activity has tilted heavily toward the put end of the spectrum, as the call to put ratios have dropped dramatically. It is difficult to differentiate between hedging and speculation in these transactions, but now that options spreads seem to be tightening and implied volatility is dropping sharply, I suspect those looking to get short financials and any other part of the market may be leaning toward puts.

It will be interesting to see how the options market is affected by the new shorting regulations.

[source: International Securities Exchange]

Friday, November 23, 2007

A Dozen Things My Trading Accounts Are Thankful For This Year

I am a strong proponent of taking stock of what is working and what is not working on a regular basis.

That being said, if my trading accounts could speak, these are some things they would be thankful for so far in 2007:

  1. More active use of trailing stops (probably the #1 reason for increased trading success in the past few years)
  2. Increased use of the VIX (and VWSI) to aid in timing the market
  3. Emphasis on put to call ratios (especially the ISEE) to evaluate market sentiment
  4. Lack of hesitation in initiating short selling positions (the end of a long bias approach)
  5. Blogging – and all the cross-pollination of ideas that it has engendered
  6. ETFs – to diversify, go short, apply leverage, etc.
  7. More time stops (including hybrid price/time stops such as a Parabolic SAR)
  8. Better strategies for taking partial profits in options positions
  9. Following the China trend, whichever direction it takes me
  10. Iron condors and other strategies to capture premium associated with high volatility and/or non-trending securities
  11. Numerous enhancements to a detailed and continuously evolving spreadsheet I use to track and analyze all my trades
  12. Standardization on a single momentum indicator for my charts: Williams %R

Wednesday, October 24, 2007

Four Generals Will Tell the Story

I am a big fan of market breadth indicators, but when considering whether or not the markets may be at a turning point, I prefer to focus on a handful of leaders rather several thousand small caps whose fortune is never to make it to CNBC’s scrolling ticker. Jeopardy may have “foods that begin with the letter Q” (one of my favorite movie scenes, for reasons I’m still not entirely sure of), but somehow I don’t think we’ll ever hear, “I’ll take micro-cap tickers for $200, Alex.”

Cramer has his “Four Horsemen of Technology” (RIMM, AMZN, GOOG, and AAPL), but this sector focus, while important, is a little too restrictive for my liking. I do think, however, that it is possible to get some meaningful information from watching only four stocks.

Right now, four areas of the economy that I am watching most closely are China, technology, global trade, and consumer spending. These areas just happen to coincide with four stocks that have been market leaders over the past few months, are current or recent members of my OHFdex (Overripe High Fliers Index), have recently made new highs, and probably need to continue to make new highs for this market to continue to the bull march.

In order of recent price strength, the four generals I am focusing on are Apple (AAPL), Baidu (BIDU), Southern Copper (PCU), and MasterCard (MA). Interestingly enough, it is possible that each of these stocks has already made an intermediate-term top. Apple has been the strongest of the group, but following an impressive earnings report on Monday evening, the stock gapped up and has slowly been drifting down since then. It would be hard to proclaim a top in AAPL right now, but the short-term momentum appears to have left the stock. Baidu’s earnings are tomorrow, but the high of October 11th is already starting to look like a possible top, as BIDU trades about 30 points below that high at the moment. Southern Copper has also been drifting down since an October 11th high; yesterday’s earnings report has done nothing to change the trend. Lastly, MasterCard’s high water mark dates from July 13th. The company has been a consistently impressive performer since it’s May 2006 IPO, during which time it has quadrupled in price. For the past three months the action has been mostly sideways, with the stock rising and falling over concerns about the impact of the credit crisis on retail spending.

My personal belief is that all four stocks will continue to come under pressure as the markets grapple with the possibility that the October 11th highs will be hard to take out. I am not a kiss and tell trader and I prefer not to talk about my trading and positions, but since many have asked, at present I am short all four generals, though I will not be short BIDU when it reports earnings tomorrow. For the record, anything less than a blowout quarter and BIDU could be the catalyst that turns the current small market correction into some longer term bearishness.

Now it’s your turn, readers. If you could only follow four individual stocks to divine the direction of the market, which stocks would those be?
Wednesday, October 10, 2007

When to Short China?

Eventually, there will come a time when you will look back and say to yourself, “Why wasn’t I short China? It was such a no-brainer…” The answer to that question has a lot to do with the dictum that the markets can stay irrational much longer than many of us can stay solvent. Ask anyone who was short tech stocks in 1999 and knew it was just a matter of time before they were proven right.
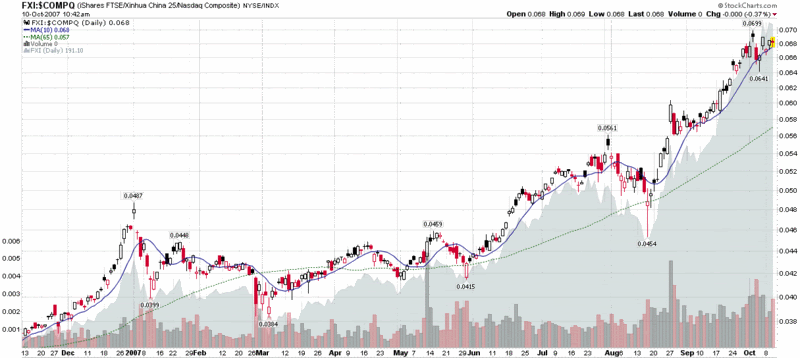
There are a number of ways to approach this problem, but ultimately you want to be short when the majority stops buying on the dips and starts selling into the rallies. When does this happen? Generally, when the short-term moving averages (such as the 10 day SMA) start to roll over and slip below the intermediate-term moving averages (i.e. the 65 day SMA) distribution is occurring.

In that same vein, ratio charts can be helpful to spot speculative trends as well. Keep your eye on the relative performance of the FXI versus the NASDAQ and remember that it is better to catch the easy middle part of the move than to call the turning points. Traders should aim for the easy money; let the so-called gurus (and bloggers) shoot for bragging rights and the easy headlines…

Tuesday, October 9, 2007

Goldman Sachs (GS) Hits New All-Time High

In case anyone was wondering, this means the looming financial crisis has officially been canceled.

As much as various sentiment indicators suggest that there is too much froth in the markets, that doesn't mean it is a good time to be short. Said another way, never try to anticipate when a fast moving locomotive will make a U-turn, but be nimble enough to grab onto the caboose as it goes by, regardless of the direction...

Monday, October 1, 2007

Quiet Before the Storm?

Though the most recent installment was published last Friday, I would be remiss in not highlighting the work done by Fred Ruffy at Optionetics.com. Fred authors a weekly Sentiment Journal that covers many of the issues I touch on here, with a mixture of charts, tables and text in an effort to summarize the week that was and provide some insights into the coming week.

Ruffy's most recent entry bears the title Quiet Before the Storm? He looks at much of the same data that interests me and we reach many of the same conclusions, mostly cautionary, about the current state of the markets. For the record, even with today's continued market strength, I find myself net short the markets (and long volatility) for the first time in 2007.

Finally, for those who may be interested, Fred also fields questions at Optionetics on their Ask Fred Ruffy discussion board.

Portfolio A1 Jumps 5% in Week

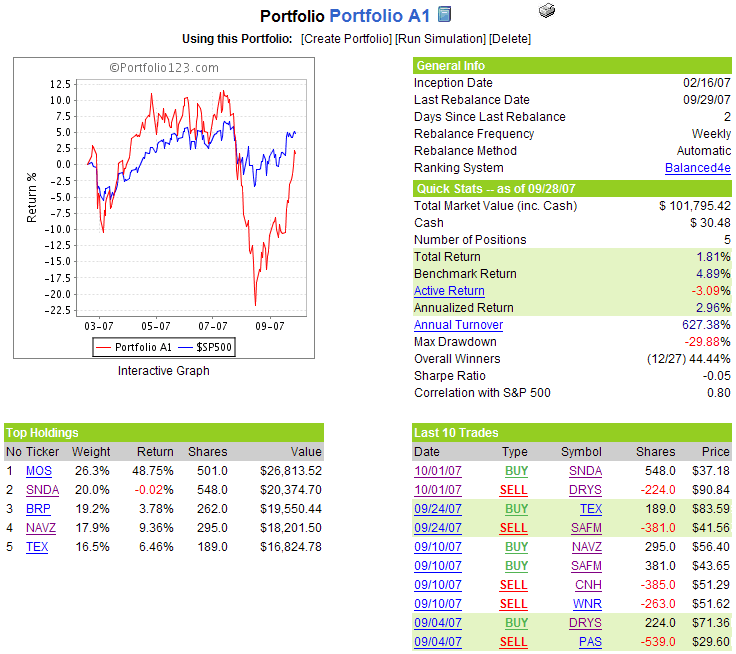
As the equity curve below shows, the August plunge has largely been eradicated in September, thanks in part to an impressive 5% gain in the portfolio last week. The strong week puts Portfolio A1’s cumulative return back into the plus column, with gains since the February 16th inception now at 1.8%. While this performance continues to trail the 4.9% gain registered by the benchmark S&P 500 index during the same period, an optimist might venture a small smile for the first time in about two months.

One unusual aspect to last week’s gains is the decision by the stock ranking system to drop DryShips (DRYS) after a stunning 27% gain in just four weeks in the portfolio. This is the first time the portfolio has dropped a double digit gainer and it is a little bit of a head scratcher, but perhaps the stock ranker has turned HAL on me taken up to reading Investor’s Business Daily, specifically a Friday article titled Smiling Dry-Bulk Shippers See The Boom Times Lasting For Years.

To replace DryShips, the portfolio has decided to dive headlong into China by picking up Shanda Interactive (SNDA), the Shanghai-based interactive entertainment company. In my discretionary trading I am short China stocks at the moment, so this portfolio may provide yet another interesting competition between man and machine.

There are no other changes to the portfolio this week.

A snapshot of the portfolio is as follows:

Monday, June 18, 2007

The Risk Library

Two weeks ago I offered up “Ten Anecdotal/Historical Book Ideas for Investors” on the premise that humans have a tendency to learn and retain more valuable concepts when the learning process is enjoyable.

This list is quite different. Risk is something that the novice trader/investor invariably fails to think about enough and properly address in their trading methodology. Interestingly, risk management is often the Achilles heel of more experienced traders who know better, but also fail to attend to with sufficient rigor.

With this in mind, I offer up some favorites from my personal library to help all traders think about risk and act to limit the risks inherent in their trading strategies, ordered roughly from the most abstract to the most prescriptive, which I often find is an excellent way to tackle any unfamiliar subject:

Against the Gods (Peter Bernstein) – A high level survey of the history of risk from the perspective of the advance of civilization. A relatively quick read that should inspire the desire to take a closer look at risk vis-à-vis investments. 

The (Mis)Behavior of Markets (Benoit Mandelbrot) – A fun and mind-expanding stew of financial risk, fractals and chaos theory. A great thought starter and surprisingly easy for non-math/physics scholars to breeze through.

Fooled By Randomness (Nassim Taleb) and The Black Swan (Nassim Taleb) – I suggest you try these in chronological order, starting with Fooled By Randomness. If Bernstein and Mandelbrot offer up two solid thought starters, then Taleb is a master of throwing gasoline on the fire. Deftly written in his own idiosyncratic narrative, Taleb’s books are bursting at the seams with ideas and ground zero is risk.

Choices, Values, and Frames (Daniel Kahneman and Amos Tversky) – Behavioral finance is a subject that is still gaining traction, but the sooner you steep your thinking in the ideas of the discipline’s founding fathers, Kahneman and Tversky, the better off you will be. This particular book is a collection of essays that you can read through at your own pace.

Manias, Panics, and Crashes (Charles Kindelberger) and/or Devil Take the Hindmost (Edward Chancellor) – Kindleberger offers a dense but informative history, while Chancellor wins out in terms of readability. Each is an excellent account of the history of speculation and market excesses; picking one of the two would probably suffice. Note that Charles MacKay’s Extraordinary Popular Delusions and the Madness of Crowds should also probably be on this historical menu, but I have not yet read it.

With Fortune’s Formula (William Poundstone), this list passes over from the largely theoretical into the prescriptive realm. This is a fun read on the Kelly criterion, set to a backdrop of blackjack and casino gambling.

A Thousand Barrels a Second (Peter Tertzakian) and/or The Oil Factor (Stephen Leeb) – There are many books out there that discuss the merits of Peak Oil. I have only read a few of them, but Tertzakian’s treatment is by far my favorite and certainly one of the more objective ones. Leeb’s book probably created a larger stir (as did his The Coming Economic Collapse, which strikes me as little more than a hastily assembled slight update of his previous book), but it covers most of the important points in much smaller bites. Every investor, Peak Oil proponent or otherwise, needs to take a close look at this subject and be prepared for how a number of oil-related scenarios may play out over the remainder of their investment time horizon.

Financial Shenanigans (Howard Schilit) – The subtitle of the book, How to Detect Accounting Gimmicks & Fraud in Financial Reports is exactly what this book is all about. Here is a fundamental approach that addresses what to look for, with an excellent treatment by Schilit. It is up to the reader to determine whether these companies should merely be avoided or whether they might also be short candidates.

How to Make Money Selling Stocks Short (William O’Neil and Gil Morales) – This is another prescriptive book and it relies entirely on a couple of basic technical analysis concepts. Even with that shortcoming, I think the true value of the book is that it will help you to actively look for short opportunities and avoid the confirmation bias that long-only approaches can sometimes succumb to. For example, if stock chart is screaming “buy” at you, would it be a “sell” if you turned the chart upside down?

When to Sell (Justin Mamis) and/or It’s When You Sell that Counts (Donald Cassidy) – While it is easy to find books on how to buy stocks, good luck finding an entire book devoted to the topic of selling them. Mamis and Cassidy are the only two books of this kind I have encountered and fortunately each offers an excellent treatment of the subject. I am slightly partial to Mamis here, but since most of us make or lose a lot more money managing existing positions than seeking better entries, my suggestion is to try both of them.

Trading Risk (Kenneth Grant) – This book is the only one I know of that offers highly detailed advice about how to evaluate the various types of risk in your holdings and take action to mitigate those risks. If I could, I would make it required reading for any newcomer to the investment world.

DISCLAIMER: "VIX®" is a trademark of Chicago Board Options Exchange, Incorporated. Chicago Board Options Exchange, Incorporated is not affiliated with this website or this website's owner's or operators. CBOE assumes no responsibility for the accuracy or completeness or any other aspect of any content posted on this website by its operator or any third party. All content on this site is provided for informational and entertainment purposes only and is not intended as advice to buy or sell any securities. Stocks are difficult to trade; options are even harder. When it comes to VIX derivatives, don't fall into the trap of thinking that just because you can ride a horse, you can ride an alligator. Please do your own homework and accept full responsibility for any investment decisions you make. No content on this site can be used for commercial purposes without the prior written permission of the author. Copyright © 2007-2023 Bill Luby. All rights reserved.
 
Web Analytics
