Showing posts with label Williams %R. Show all posts

Monday, November 12, 2007

NASDAQ Chart with Hourly Bars

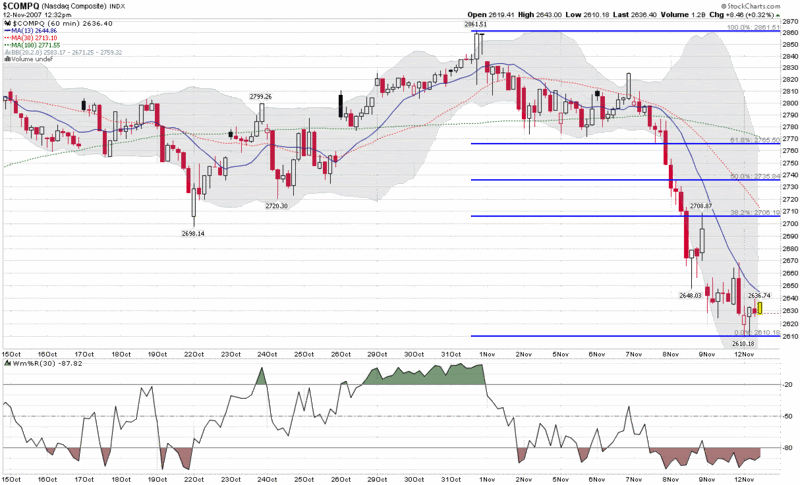
On Friday I posted a weekly chart of the NASDAQ going back six years. Today I am swapping the wide angle lens for a telephoto one and focusing on hourly bars for the past month. I am emphasizing the NASDAQ Composite (and the NDX) because that is where a good deal of the speculative activity has been as of late and where the correction was most severe last week.

The graph below shows four semi-arbitrary simple moving averages for the NASDAQ Composite Index: 13 bars; 20 bars (the faint dotted gray line in the middle of the Bollinger Bands); 30 bars (the same as the Williams %R time frame); and 100 bars. All this spans roughly a period of 1 ½ days to about 3 weeks. With the aforementioned Bollinger Bands and Williams %R data, as well as the Fibonacci retracement lines, there are many ways to keep score. As much as anything, however, I will be looking at the intensity and duration of the bull rallies off of the bottom. Given that many indicators point to the current situation as significantly oversold, the absence of a compelling bull rally may provide as much information as what is actually happening. In other words, a draw should favor the bears.

Finally, I still haven’t seen much in the way of fear yet…
Thursday, October 25, 2007

Two Thoughts on the McClellan Summation Index

For the most part, my trading time horizon is one of hours and days, yet I do have a long-term portfolio that helps motivate me to periodically check out trends and themes that may take months or years to play out.

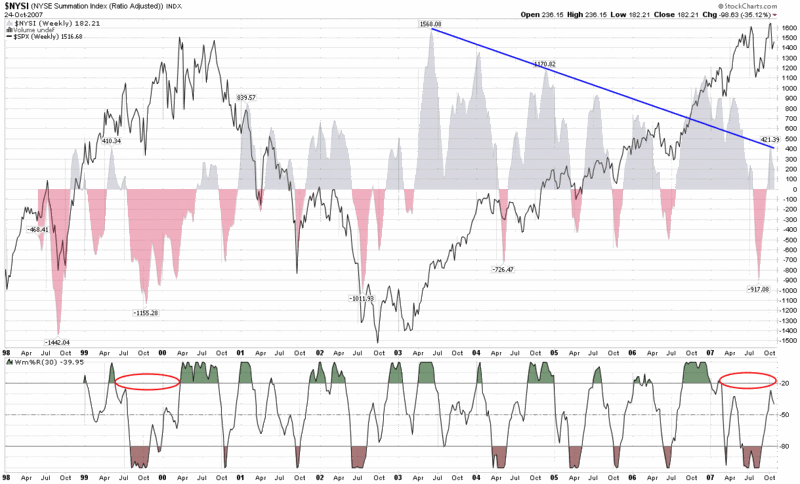
One of my favorite indicators to assist in looking at intermediate and long-term trends is the McClellan Summation Index, which I have talked about here on several occasions in the past. Lately I have been looking at a weekly version of the chart that goes back to 1998 (the farthest StockCharts.com has to offer) and two things have been gnawing at me.

(Of course I should probably preface my remarks by noting I have some concern that once my gut starts to go bearish – which it does not do very often, but has done lately – I wonder whether my chart reading starts to suffer from confirmation bias.)

The first concern I have is the possibility that the trend of lower highs in chart (represented by the blue line that conveniently ignores the data from late 2006 through early 2007) may turn out to be significant, particularly if the relatively low peak of 421 earlier this month cannot be surpassed in the near future.

The second concern I have is the amount of time that the Williams %R indicator has spent below the -20 line. Looking back at the chart, the only other time I can see that the Williams %R failed to generate these high values for at least nine months or so was in the last nine months of the 1999-2000 bull market top.

It seems like a long shot, but each of these two observations continues to bother me.

Friday, October 5, 2007

Where Will the VIX Find a Bottom?

Let me start out by stating for the record that I have no idea whether it is appropriate to use traditional charting and other technical analysis techniques to attempt to determine support and resistance levels for the VIX. After all, the VIX is a multi-generational derivative that is a good distance removed from reality. For purposes of simplification, think of the VIX as a shadow puppet (more accurately, the composite shadow puppet from 500 simultaneous light sources); if we want to learn more about it, should we study the shadows or consider the hands from which the shadows are cast? I have a tendency to talk about the shadows, but for charting purposes I am inclined to believe that they are still just shadows.
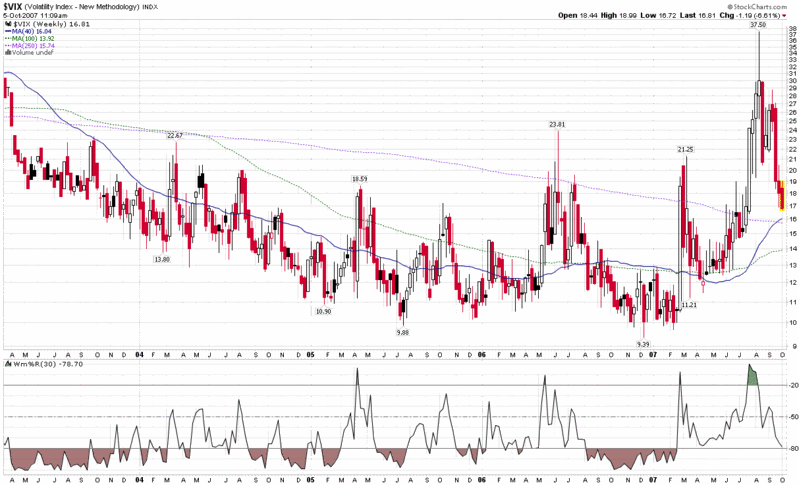
So…with that backhanded disclaimer out of the way, let me turn my attention to a VIX that just made an intra-day low of 16.63. Whether that number sounds high or low depends upon where you have been anchoring a ‘normal’ price in your mind. At 16.63, the VIX is 68% above the year’s low (9.87), 56% below the year’s high (37.50), and about 7% above the VIX’s lifetime mean, which stands at 18.93.

I recently made a guesstimate that the VIX would bottom in the 16-17 range in October and I have no reason to depart from that thinking. I will, however, offer the weekly chart of the VIX below as one way to think about that 16-17 support range. Instead of the long-term moving averages (which may look interesting, but are of dubious value), focus instead on the Williams %R number. When the %R crosses below -80, it has a tendency to signal a bottoming out in the VIX – to the extent that you can tell when a shadow puppet is bottoming out…

Tuesday, September 4, 2007

The Emerging Markets Engine

As I write this, the EEM is about 6% off of its 52 week high, but even this number dramatically understates the staying power of this emerging markets ETF.

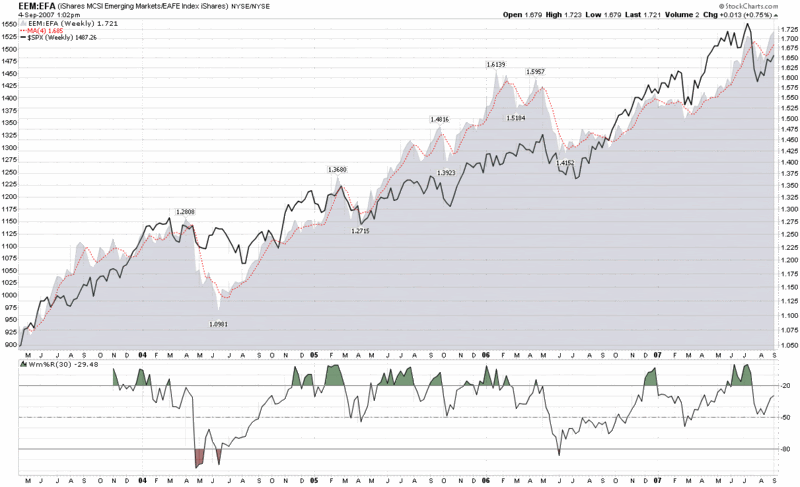
A better way to think about the strength of the EEM is to look at its performance relative to that of the EFA, a capitalization-weighted ETF that necessarily tilts strongly in the direction of the most developed countries in Europe, Australasia and the Far East, as the fund’s holdings confirm.

Looking at a ratio chart of the EEM to the EFA, you can see that over the course of the past 4 ½ years, returns in emerging markets have consistently outstripped those of the EFA, save for two brief periods in the summer of 2004 and the summer of 2006. What I find particularly interesting is that the normally skittish emerging markets barely flinched (note the Williams %R) during the corrections that hit the SPX in February and July of this year. Not only were the dips in emerging markets brief, but the recovery in these markets was much stronger and faster than it was in the SPX or the EFA, as anyone who has watched the Chinese markets and the FXI ETF in particular can attest to.

Other ratios of speculative activity, such as the capitalization ratios of the RUT:OEX or RUT:SPX, reflect some of the battle scars of the last few months. Speculative activity in emerging markets, however, continues to show healthy investment in that sector. Whether speculation in emerging markets is in fact too healthy may become an issue in the coming year, but for now I am content to conclude that a powerful emerging markets engine is a positive signal for the global economy.

Tuesday, July 10, 2007

Good News from the McClellan Summation Index

The last time I talked about the McClellan Summation Index, I used a weekly chart to demonstrate how this indicator can provide some advance notice of market tops and bottoms.

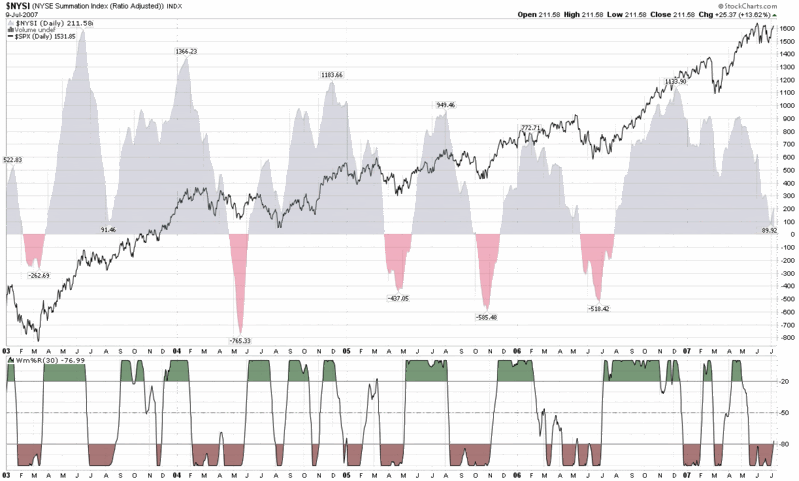
Today my focus is more on the Williams %R momentum indicator that I have included with the daily chart of the McClellan Summation Index (which StockCharts.com codes as the $NYSI or NYSE Summation Index.) In this chart, which spans from 2003 to the present, I use 30 bars for the Williams %R indicator instead of the more common 14 bars in order to minimize some of the choppiness and provide more reliable signals.

In terms of a strong intermediate term bullish signals, what I look for in the chart below is for the Williams %R to cross the -50 center line, which is usually does shortly after moving above the -80 level. While I will generally wait for the official confirmation at the -50 level, you can usually anticipate that event when the %R rises above -80. With yesterday’s close of -77, I would expect that we would get another bullish signal from the McClellan Summation Index – Williams %R (30) very soon.

For those interested in checking the reliability of this indicator, you can eyeball the chart to determine that this center line crossover approach gave 9 highly profitable bullish readings, 1 neutral to unprofitable reading (May ’04), and 2 readings (February ’05 and February ’07) that were unprofitable – all of which one assumes a minimum holding period of 1-2 months.

Sunday, February 18, 2007

New Feature #1: VIX Weekly Sentiment Indicator

The time has come to start adding some regular features to this blog, in addition, of course, to the regular barrage of pastel Excel charts…

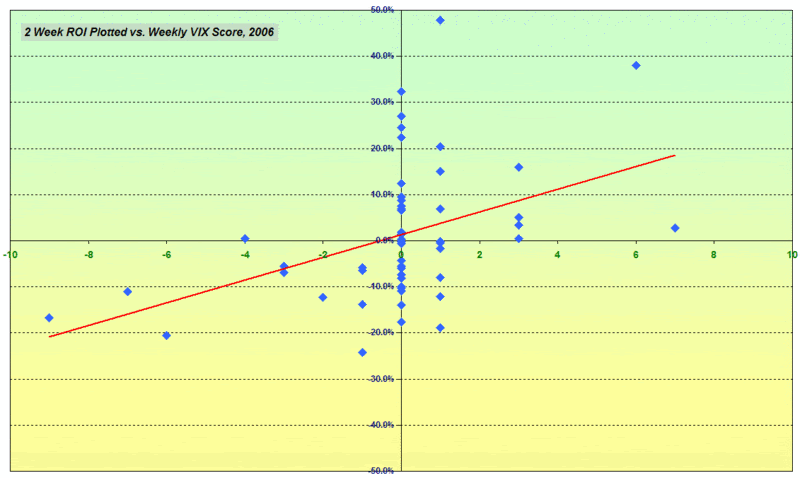
Today I am introducing the VIX Weekly Sentiment Indicator – or VWSI if you like unwieldy acronyms. The intent of this indicator is to gauge the future movements of the VIX in the coming week or so. In fact, the indicator has proven to be a useful tool for predicting VIX moves in the 1-4 week period. For better or for worse, I will not be trotting out a bunch of statistics to demonstrate how well the VWSI would have performed over various backtesting periods. Instead, consider the following scatter plot showing the two week ROI on various VWSI scores from 2006 as reasonably representative of the predictive power the VWSI:

The factors that have the largest impact on VWSI scores are largely oscillator calculations involving various simple moving averages, the Commodity Channel Index, the Williams %R indicator, and others. It is worth noting that the weekly VWSI scores have no memory of the previous week’s scores. Therefore, even while the value of a score may have tradeable implications for a 1-4 week period, a new score is constructed from scratch each week. As a result, extreme VWSI scores rarely persist for more than one or two weeks.

Finally, the VWSI temperature gauge below should be relatively self-explanatory, particularly if you keep in mind that the "bullish" and "bearish" labels apply to the VIX, not to the broader markets, which are usually negatively correlated with the VIX. The reading for the week ending 2/16/07 is +1, which is considered to be in the neutral zone. Last week’s VWSI reading was an even zero.

Thursday, February 8, 2007

Bird Flu Stocks and Volatility

Confirmation of bird flu at a UK turkey farm over the weekend put bird flu stocks back in the spotlight once again. Over the past two years, most of us have become largely desensitized to the possibility of a widespread bird flu outbreak, as each incident has spawned a less and less strident media frenzy. In a sense, the same soft of desensitization has set in over the past year or two with bird flu, terrorism, $100/bbl. oil, Iraq/Iran, North Korea, etc. The media has a field day for awhile, but as the panic level subsides for a second or third time, the public sees these as more cry wolf exercises and makes a mental note to ignore future scare tactics and, in many cases, completely tune out the entire issue.

Is this why the VIX has now made 33 consecutive new lows for the 100 day SMA? Perhaps it is not so much complacency that has set in as mass desensitization.

Back to bird flu stocks. Their price movement has a strong fear component in them and as such, they are part of the VIX taxonomy of fear (which I will someday formalize as the VIXdex.) It should come as no surprise, then, that bird flu stocks have characteristics that are similar to that of the VIX. Specifically, they tend to spike up sharply, then subside over time, with patterns of 1 and 3-5 day spikes being relatively common. Some of this can be seen in the BCRX daily chart, where the Williams %R and CCI are showing that four days into the move up, we have a good shorting opportunity:

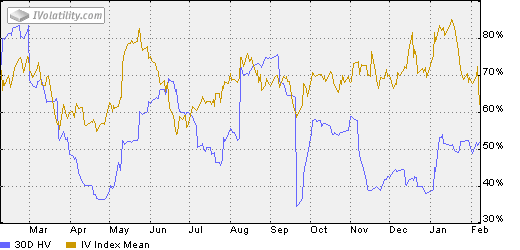
NVAX, AVII and GNBT are among my favorite of the pure play bird flu vaccine makers. If you have tested systems for trading the VIX, consider that the same tactics may work as well or better with bird flu stocks, with an opportunity to trade the underlying and with lower implied volatility for the options:


DISCLAIMER: "VIX®" is a trademark of Chicago Board Options Exchange, Incorporated. Chicago Board Options Exchange, Incorporated is not affiliated with this website or this website's owner's or operators. CBOE assumes no responsibility for the accuracy or completeness or any other aspect of any content posted on this website by its operator or any third party. All content on this site is provided for informational and entertainment purposes only and is not intended as advice to buy or sell any securities. Stocks are difficult to trade; options are even harder. When it comes to VIX derivatives, don't fall into the trap of thinking that just because you can ride a horse, you can ride an alligator. Please do your own homework and accept full responsibility for any investment decisions you make. No content on this site can be used for commercial purposes without the prior written permission of the author. Copyright © 2007-2023 Bill Luby. All rights reserved.
 
Web Analytics