New Feature #1: VIX Weekly Sentiment Indicator
The time has come to start adding some regular features to this blog, in addition, of course, to the regular barrage of pastel Excel charts…
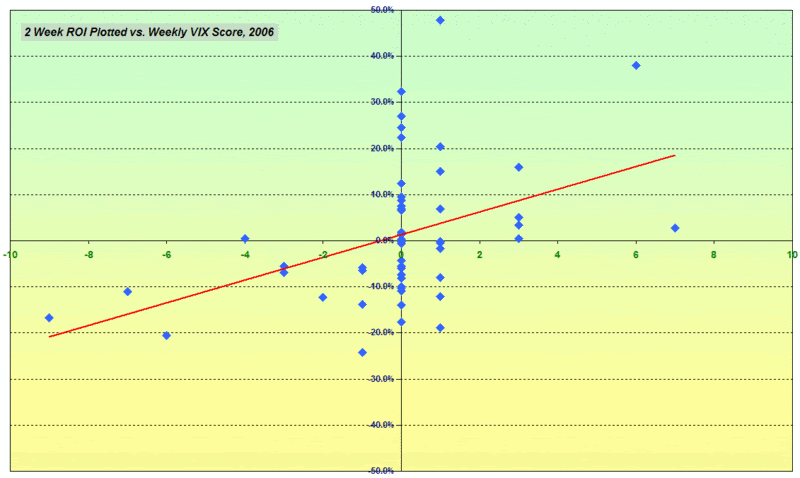
Today I am introducing the VIX Weekly Sentiment Indicator – or VWSI if you like unwieldy acronyms. The intent of this indicator is to gauge the future movements of the VIX in the coming week or so. In fact, the indicator has proven to be a useful tool for predicting VIX moves in the 1-4 week period. For better or for worse, I will not be trotting out a bunch of statistics to demonstrate how well the VWSI would have performed over various backtesting periods. Instead, consider the following scatter plot showing the two week ROI on various VWSI scores from 2006 as reasonably representative of the predictive power the VWSI:
The factors that have the largest impact on VWSI scores are largely oscillator calculations involving various simple moving averages, the Commodity Channel Index, the Williams %R indicator, and others. It is worth noting that the weekly VWSI scores have no memory of the previous week’s scores. Therefore, even while the value of a score may have tradeable implications for a 1-4 week period, a new score is constructed from scratch each week. As a result, extreme VWSI scores rarely persist for more than one or two weeks.
Finally, the VWSI temperature gauge below should be relatively self-explanatory, particularly if you keep in mind that the "bullish" and "bearish" labels apply to the VIX, not to the broader markets, which are usually negatively correlated with the VIX. The reading for the week ending 2/16/07 is +1, which is considered to be in the neutral zone. Last week’s VWSI reading was an even zero.


7 comments:
Here's an interesting article I found on the VIX. I like you blog. Keep up the good work.
http://www.minyanville.com/articles/index.php?a=12171
Thanks lifepost. We kicked around what Schaeffer said in http://vixandmore.blogspot.com/2007/02/why-is-vix-so-low.html
Adam Warner at the Daily Options Report probably had the best post I saw on Schaeffer's remarks; the comment from 'anonymous' at the bottom provides some food for thought at well: http://adamsoptions.blogspot.com/2007/02/weekend-at-beyonces.html
Bill, great stuff. Though good enough for pro, I recommend a little more explanation on VWSI and how one can use it. Cheers and keep up the good work. I am going to mention this on my blog.
Profitable trading,
OptionPundit
www.OptionPundit.net
Hi pundit. I appreciate your comments a great deal.
Frankly, I have been a little concerned about turning this blog from a largely informational resource over to one that is mostly trading-based. So far, I talked a little bit about how to trade the VIX in my first post here: http://vixandmore.blogspot.com/2007/01/week-in-vix-january-7-2007-introduction.html
I have already touched on some of the indicators I use, some time frames, options strategies, etc. At this stage, I don't think I'll describe in any more detail a VIX-based trading system.
When the VWSI prints a strong bullish or bearish signal, I will certainly talk about ways to play it at that point, expectations, etc. Until then, I'll probably keep most of this on the back burner.
You mentioned the inputs to the VWSI, but how do you crunch them all together to create a number on your log scale?
As a clarification, I'm not so much interested in the "How do I use it" as much as I'm wondering the "How do I get a functional answer".
drjeff, I am not going to divulge the exact formula, but the most important inputs are several SMAs...so that if you see readings of >+3 or <-3, it is usually a function of extreme divergences from the SMAs kicking in -- and with it an expectation that the VIX will move back in the direction of the SMA reading over the course of the next 5-10 days.
Post a Comment