Friday, November 30, 2012

XIV and ZIV Are Huge Success Stories Two Years After Launching

It was two years ago today that VelocityShares launched their six VIX-based exchange-traded products and I’m fairly certain I was the only one who was covering that event on the day of the launch: Impressive Launch for Sextet of New Volatility ETNs from VelocityShares.

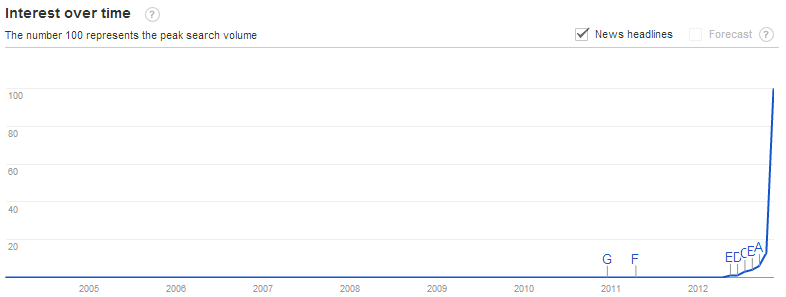
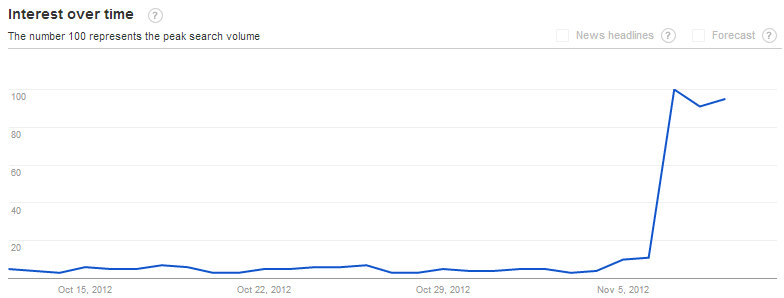
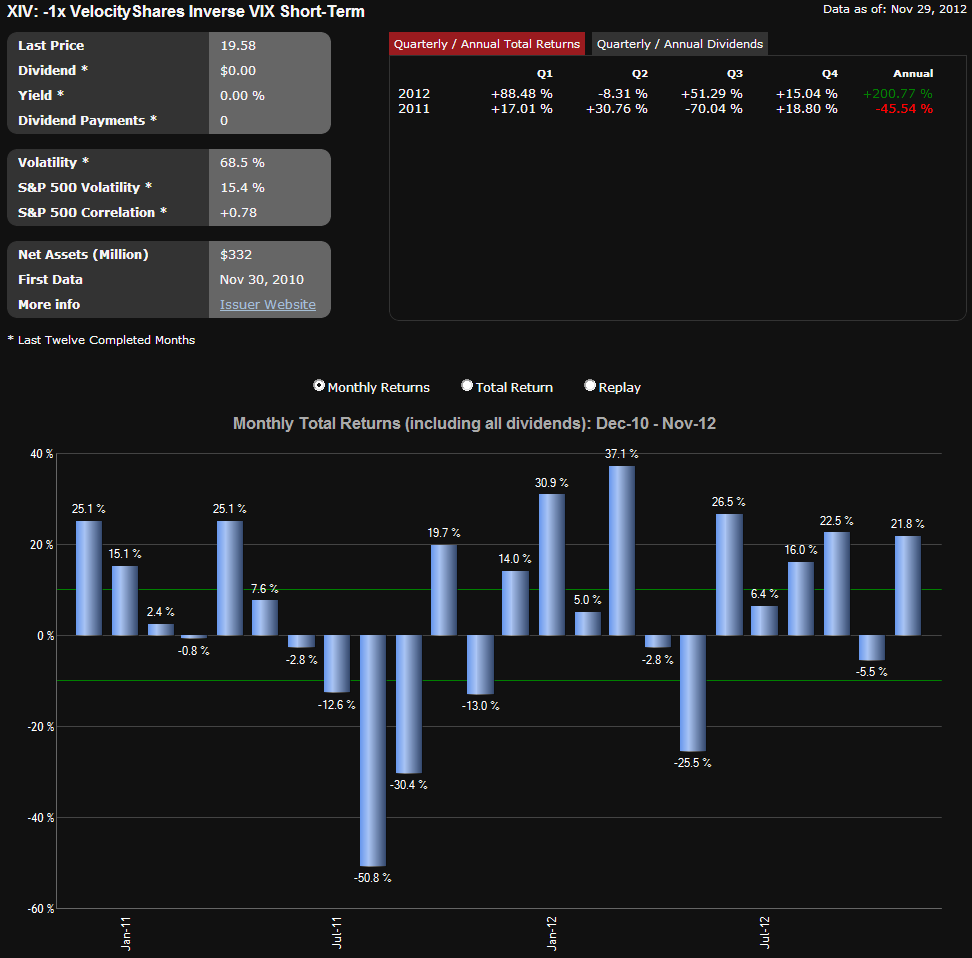
Two years later, one of these products, the VelocityShares Daily Inverse VIX Short-Term ETN, (XIV), is an unqualified success in terms of assets and performance. Over the last three months, XIV has traded an average of more than 12 million shares per day, making it the second most popular VIX-based ETP, after VXX. Part of the reason for XIV’s popularity is no doubt due to performance. As the chart below shows, XIV is up more than 200% for 2012 and has been the top performer across all ETPs for the year.

The amazing thing about the performance of XIV is that it was not very difficult to predict. In fact, less than one week after XIV was launched, I unveiled my bullish forecast for XIV in the Bespoke Investment Group’s second annual roundtable. When asked about some of my favorite picks for 2011 and beyond, I predicted:

“2011 will mark the rise of volatility as an asset class.  Part of the reason for this rise will be the runaway success of VIX-based ETNs and ETFs, notably the recently launched XIV, which will prove that volatility vehicles can be good buy-and-hold investments.”

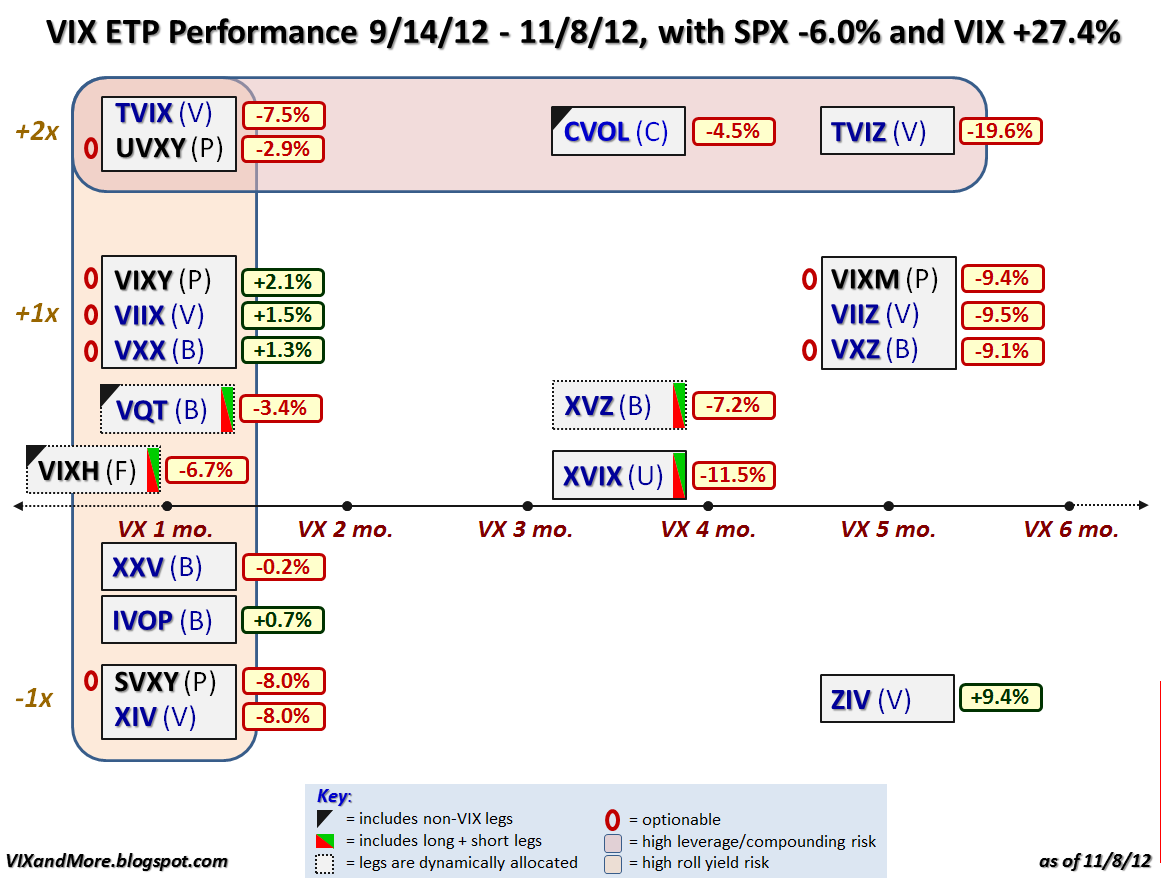
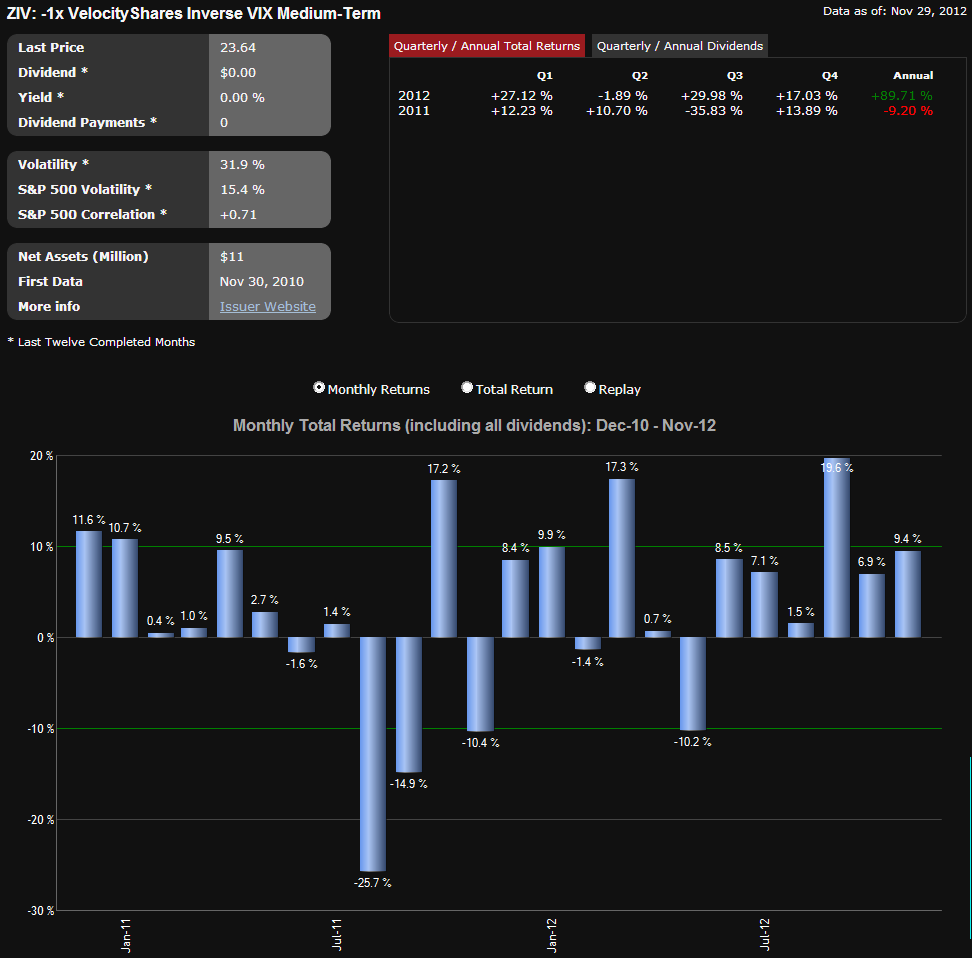
As meteoric as the rise of XIV has been, what surprises me is how little attention XIV’s sibling, ZIV, (VelocityShares Daily Inverse VIX Medium-Term ETN) has received. ZIV typically trades about 10,000 shares per day and yet this ETP has outperformed XIV by a substantial margin since the two were launched. Not only has ZIV been a better performer, but it has done so with considerably less risk. In 2011, for instance, XIV was down 45.54% for the year, while ZIV incurred a loss of only 9.20%. I thought perhaps that my ZIV Undeservedly Neglected post from January of this year might jump-start some interest in ZIV, but for some reason, investors continue to shy away from this impressive performer.

The other four products that VelocityShares launched with XIV and ZIV have had mixed results. The most famous of these is TVIX, which was briefly the top VIX-based ETP in terms of volume in February, before Credit Suisse (CS) suspended creation units in the product, which opened the door to the ProShares Ultra VIX Short-Term Futures ETF (UVXY) displacing TVIX as the top +2x VIX-based ETP. For the most part, VIIX, VIIZ and TVIZ have operated as niche products since their launch.

Going forward, don’t be too surprised if XIV and ZIV continue to post impressive numbers and if you haven’t yet looked at ZIV, it is never too late to do so.

Related posts:

[source(s): ETFreplay.com]

Disclosure(s): long XIV, long ZIV, short VXX and short UVXY at time of writing

Monday, November 26, 2012

Fiscal Cliff Concerns Top Fear Poll, But Central Banks and Politicians Seen as Key Systemic Threats

Concerns about the U.S. fiscal cliff continued to top the VIX and More weekly fear poll, while investor anxiety regarding weak earnings, Israel and China all declined substantially.

The biggest change in investor fears over the course of the past two weeks is a growing trend toward the mistrust of the role of institutions such as central banks and governments in economic matters. Concerns about central bankers and politicians are significant enough to poll in the #3 and #4 spots for all respondents, but rate even higher in the U.S., where government and politicians were the #2 concern and excessive central bank intervention worries garnered the #3 spot.

If one considers the fiscal cliff and the European sovereign debt crisis (still polling in the #2 slot on a global basis) to be situations that have been caused by and/or exacerbated by central banks, governments and politicians, then it is not too difficult to pin some 75-80% of all investor fears on central banks and governments.

As noted in previous weeks, the persistent Americentric bias shows no signs of abating. This week, for example, 12.4% more of the U.S. respondents cited the fiscal cliff as the top concern over the European sovereign debt crisis. For non-U.S. respondents, however, the fiscal cliff outpolled the European sovereign debt crisis by only 2.8%.

Once again, thanks to all who participated in this weekly poll.

Related posts:

Disclosure(s): none

Monday, November 19, 2012

Fiscal Cliff and European Sovereign Debt Concerns Recede, Earnings Worries Linger

Concerns about the U.S. fiscal cliff and the European sovereign debt crisis both declined over the course of the past week, as stocks made a concerted effort to establish a bottom, following an 8.9% decline in the S&P 500 index, according to the VIX and More weekly fear poll.

Even though the earnings reporting season is almost over, investors continued to express concern about weak earnings and guidance going forward, with earnings worries finishing a close third in the poll.

The biggest changes in investor sentiment have come in the form of growing discontent with institutions such as central banks and governments and concerns that their intervention in economic matters will have more of a negative than positive effect. Fears about excessive intervention on the part of central banks as well as more broadly with the role of governments and politicians were largely absent just two weeks ago. Taken together, this lack of trust with respect to the two influential policy-making institutions is now as big as concern as that of the fiscal cliff or the euro zone woes, as shown in the graphic below.

The persistent Americentric bias is still apparent. This week, for example, 8.5% more of the U.S. respondents cited the fiscal cliff as the top concern over the European sovereign debt crisis. For non-U.S. respondents, however, the European sovereign debt crisis outpolled the fiscal cliff by a margin of 3.2%.

Also of note from a geographical perspective, U.S. respondents were 1.8% more likely than non-U.S. respondents to tab excessive central bank intervention as their top fear and 5.9% more likely to point to government and politicians as their biggest concern. In addition to placing higher emphasis on the European sovereign debt crisis, non-U.S. respondents also expressed much more concern about China and deflation.

Once again, thanks to all who participated in this weekly poll.

Related posts:

Disclosure(s): none

Guest Columnist at The Striking Price for Barron’s: Calm Down and Exploit Others’ Anxieties

On Wednesday I had an opportunity to serve as a guest columnist for The Striking Price on behalf of Steven Sears at Barron’s for the eighth time, focusing my attention on some of the early findings from the VIX and More Fear Poll in Calm Down and Exploit Others’ Anxieties.

In some respects, the most recent Barron’s article is a companion piece to another Barron’s article I penned in May: Be Greedy While Others Are Fearful. This time around I delve into some of the emerging behavioral finance aspects of the survey results, specifically related to geographical and temporal proximity bias. I also discuss the merits of a SPY short straddle trade as well as long VIX puts as a means to take advantage of some market distortions due to that bias.

As far as the most recent Fear Poll goes, this week the race for the top spot looks as if it will go down to the wire and for the first time so far, there are more than two viable candidates for the top slot. [If you have not voted in the weekly poll yet, now is as good a time as any…]

Related posts:

A full list of my Barron’s contributions:

Disclosure(s): none

Monday, November 12, 2012

Fear Poll: Fiscal Cliff Fears Spike, Concerns About Excessive Central Bank Intervention Rise

For the fourth week in a row, the U.S. fiscal cliff topped the list of investor fears about the stock market. With all the media attention heaped on the fiscal cliff since the election, it should come as no surprise that the fiscal cliff outpolled the second-place European sovereign debt crisis by 10.9%, the widest margin since the Fear Poll began four weeks ago.

Concerns about continued weak corporate earnings held on to the #3 spot, even as the earnings season winds down, while anxiety about problems related to excessive central bank interventions moved into the #4 slot. Among write-in votes, the biggest issue is frustration with government and politicians, which is certainly related to some of fears about how the fiscal cliff and euro zone problems will be resolved.

The Americentric perspective was once again in evidence this week, with U.S. respondents seeing the fiscal cliff as more concerning than the European sovereign debt crisis by a margin of 16.2%, while non-U.S. respondents saw the two issues as almost equally important, with the fiscal cliff winning out by only 1.8%. Interestingly, this parochialism seems to be a largely American phenomenon, as Israeli respondents have been less concerned about Iran than non-Israeli respondents and German respondents have been less concerned about the European sovereign debt crisis than the rest of the world.

With the U.S. elections now in the rear view mirror, U.S. respondents were no doubt at least partly influenced by the media pivoting away from the elections and toward the fiscal cliff issues – a development I analyzed yesterday in The Rise of Fiscal Cliff Concerns.

Thanks to all who have participated in these polls and have helped to generate a very interesting data set. Clearly we have a lot to learn about what drives fear and how those fears can be amplified by geography, media and proximity in time.

Related posts:

Disclosure(s): none

Sunday, November 11, 2012

The Rise of Fiscal Cliff Concerns

How much of the recent selloff in stocks has been triggered by media’s sudden obsession with the U.S. fiscal cliff? Is it possible that very little has changed under the surface, but the decibels associated with this issue are now off the charts?

For the last three weeks, VIX and More Fear Poll respondents have rated the issues surrounding the U.S. fiscal cliff as their biggest source of fear about the future of the stock market. Now that the election is behind us and the earnings season is winding down, these fears have been buttressed by a huge amount of media scrutiny suddenly being devoted to the subject.

The fiscal cliff is one of those issues that has been on the horizon for many months, but only recently have investors begun to pay attention to the problem. Part of the reason for this sudden interest in the fiscal cliff is that Congress and the Obama Administration were not going to address the fiscal cliff during the campaign season and consequently no one expected any progress on the fiscal cliff issues during this period. Now that the election is over, the issue is seen as a ticking time bomb, with a much shorter fuse each day.

While politicians, economists and business leaders across the globe have called for a speedy resolution of the fiscal cliff negotiations between Democrats and Republicans, the highly respected Congressional Budget Office added some new urgency to the dialogue with the publication of two new documents on Thursday:

  1. Economic Effect of Policies Contributing to Fiscal Tightening in 2013
  2. Choices for Deficit Reduction

I cannot say that I pay much attention to the likes of CNBC and Bloomberg TV, but I understand that the fiscal cliff issue is now dominating the business television airwaves as well.

All this makes me wonder just how much of the recent selloff in stocks is driven by substance and how much is driven by the media frenzy.

I took a look at the Google Trends data for “fiscal cliff” and discovered that the issue barely registered on Google’s radar until about May of this year.

[source(s): Google Trends]

There was an occasional mention of the fiscal cliff up through last Sunday, then on Monday, the day before the U.S. election, new interest in the subject began to surface. The big spike in interest in the fiscal cliff happened on the day following the election, when Google search volume in “fiscal cliff” rose tenfold and the media frenzy began.

[source(s): Google Trends]

Over the weekend, concerns about the fiscal cliff have been outpolling (voting is still open) concerns about the ongoing European sovereign debt crisis by the largest margin yet. The real question is whether this is due largely to a redirection of attention by the media and by investors or by changes in the underlying nature of the issue or the likelihood of a timely resolution to the problem. My guess is that more of the former is at work than the latter.

Related posts:

Disclosure(s): none

Thursday, November 8, 2012

Performance of VIX ETPs During Current Pullback

Of all the issues discussed in this space, undoubtedly the one that captures the imagination of most readers is the subject of VIX-based exchange-traded products. I get more questions about the construction of these products, how they respond to the VIX futures term structure, what factors influence performance, etc.

For these reasons I thought it might be instructive to update my VIX ETP landscape chart and include performance data from the September 14th market closing high of SPX 1465 to today’s close of SPX 1377. During that period, the SPX declined 6.0% on a close-to-close basis, while the VIX jumped 27.4% during the same period.

So how did the VIX ETPs fare while the market was selling off?

In examining the graphic below, the first thing you probably notice is that only 5 of the 19 VIX ETPs were able to manage gains during the selloff. In fact the average (mean) VIX ETP performance was a disappointing -4.9%, while the median return was -6.7%. Even more interesting, the inverse volatility products actually outperformed their long volatility counterparts and had the top performer of all, the VelocityShares Daily Inverse VIX Medium-Term ETN (ZIV).

In addition to the static allocation long and short volatility ETPs, there are also three products that use rules-based formulas to dynamically allocate the amount and type of long volatility exposure: VQT, XVZ and VIXH. None of these three products was able to produce a profit during the selloff and the top performer among the group, VQT, managed a loss of 3.4%.

I previously superimposed performance data on this same VIX landscape graphic back on April 3rd in VIX ETP Returns for Q1 2012, following a 12.0% gain in the SPX during that quarter and a 33.8% drop in the VIX. Note that only two VIX ETPs managed to post gains during the bullish first quarter and the selloff of the past eight weeks: ZIV and IVOP. If anyone wonders why I never bother to mention IVOP, first off it has only traded on three days during the past month and second, it has a participation of only 0.13, which means essentially that the portfolio moves as if only 13% of the assets were invested in the underlying index and the balance remained in cash.  As for ZIV, I have been all over this one, including a feature post, ZIV Undeservedly Neglected, back in January.

Now that VIXH has been added to the mix of VIX ETPs, I will endeavor to provide performance updates on some or all of the VIX ETP product space on a more frequent basis going forward.

In the meantime, for those who are in search of reasons why some of the VIX ETPs outperform their peers in various market regimes, the links below are an excellent place to begin your research.

Related posts:

[source(s): Yahoo]

Disclosure(s): long ZIV and XVZ at time of writing

Wednesday, November 7, 2012

SPX Pullback Hits 5.9%, Fourth Longest Drawdown Since March 2009 Bull Began

The S&P 500 index fell as low as 1388 today, down 86 points or 5.9% from its September 14th high of 1474.

The table below summarizes all the peak-to-trough pullbacks in the SPX since the March 2009 bottom. Note that while a 5.9% drawdown is right in the middle of the pack in terms of the magnitude of the drop, the 36 days that it has taken for stocks to fall that far makes the current pullback the fourth longest in terms of peak-to-trough duration. Of course, these statistics all assume that today’s low will mark a bottom – and while recent market action supports that thesis, there are no guarantees that SPX 1388 will hold.

Also worth noting is the fact that 2012 is the first year that has seen more than one pullback with a duration of at least a month. There are several ways to interpret this. One, of course, is that when there has been weakness as of late, that weakness has persisted for a long time. Another way to interpret the lengthy pullbacks might be that the tendency of the bulls to buy on the dips has diminished the likelihood of sharp downward moves in stocks.

Related posts:

[source(s): Yahoo]

Disclosure(s): none

Monday, November 5, 2012

Fiscal Cliff Worries Grow As Election Nears

Anxiety over the outcome of the U.S. fiscal cliff topped the list of investor fears about the stock market for the third week in a row, outpolling the European sovereign debt crisis, which finished a distant second, and U.S. elections, which edged out weak earnings for third place.

With 65% of responses coming from U.S. voters, the poll results were once again skewed toward an Americentric perspective. Three weeks into this poll, it appears as if geographical and temporal proximity are having a strong effect on respondents. For third week in a row, U.S., respondents were much more concerned about events in their own country. For example, the fiscal cliff outpolled the European sovereign debt crisis by 14.8% in the U.S., while non-U.S. respondents had these two issues deadlocked in a tie for first place. Similarly, 13.9% of U.S. respondents cited U.S. elections as their top worry, while just 5.3% of non-U.S. respondents placed U.S. elections at the top of the list.

Not surprisingly, concerns about a weak earnings season fell sharply over the course of the past week, from 18.6% to 9.7%, as most of the critical earnings reports are already in the books and the potential for meaningful surprises has diminished substantially, as shown in the graphic below.

With most of the election uncertainty about to be resolved tomorrow, I anticipate that the fiscal cliff and the European sovereign debt crisis will once again separate from the pack in the next week. Whether this will place upward or downward pressure on the VIX remains to be seen.

Related posts:

Disclosure(s): none

How High Might the VIX Spike?

Given all the drama in the euro zone, not to mention the fiscal cliff, the various difficulties in China, continued unrest in the Middle East and Northern Africa, etc. it is more than a little surprising that the CBOE Volatility Index (VIX) has failed to trade above 30.00 this year.

In fact, with a maximum VIX of just 27.73 for the year, 2012 could mark the first time in 15 years (if one excludes the great Greenspan liquidity bubble from 2004 – 2006) that the VIX has not made it out of the twenties.

How does 27.73 compare as an annual high in the VIX? Since 1990, the mean high in the VIX has been 37.90 (inflated somewhat by the 2008 high of 89.53), while the median high VIX has still been a reasonably lofty 35.93.

This is not to suggest that the markets have been mispricing SPX options (and therefore the VIX) for most of 2012, only to note that there are certainly quite a few chapters remaining in the European sovereign debt crisis and the fiscal cliff drama, several of which will unfold before the year is over.

This could be one of those years in which the VIX never makes it into the thirties, but if that is to be the case, it will have to buck some fairly high odds in the process.

Related posts:

[source(s): CBOE, Yahoo]

Disclosure(s): none

Friday, November 2, 2012

Stocks and Economic Data Continue to Move in Opposite Directions

Four months ago, in The Economic Data Cliff, I discussed the rapidly deteriorating economic data relative to expectations and noted the sudden strong divergence between economic data and the stock market

At the time I offered two potential explanations:

“Perhaps stocks are decoupled from reality and are merely postponing the inevitable decline, but there also exists the possibility that stock prices are beginning to reflect the possibility an economic turnaround at the end of the year or in early 2013.”

With the benefit of four months of hindsight, the relationship between economic data and the stock market is no less murky. After being tightly correlated for 2 ½ years, stocks and economic data have been moving in almost the exact opposite direction since the beginning of June, no doubt partly due to the intervention of central banks across the globe.

What I find particularly interesting in the graphic below, however, is that just as the trend in economic data relative to expectations began diverging from stocks in June, the two began converging again when economic data began to show signs of improvement about a month ago.

Of course none of this will come as a surprise to those investors who saw today’s promising nonfarm payrolls report as an excuse to buy some stocks this morning. For now at least, stocks and the economy continue to move in opposite directions – whether that means up or down for stocks.

[Readers who are interested in more information on the component data included in this graphic and the methodology used are encouraged to check out the links below. For those seeking more details on the specific economic data releases which are part of my aggregate data calculations, check out Chart of the Week: The Year in Economic Data (2010).]

Related posts:

[source(s): various]

Disclosure(s): none

DISCLAIMER: "VIX®" is a trademark of Chicago Board Options Exchange, Incorporated. Chicago Board Options Exchange, Incorporated is not affiliated with this website or this website's owner's or operators. CBOE assumes no responsibility for the accuracy or completeness or any other aspect of any content posted on this website by its operator or any third party. All content on this site is provided for informational and entertainment purposes only and is not intended as advice to buy or sell any securities. Stocks are difficult to trade; options are even harder. When it comes to VIX derivatives, don't fall into the trap of thinking that just because you can ride a horse, you can ride an alligator. Please do your own homework and accept full responsibility for any investment decisions you make. No content on this site can be used for commercial purposes without the prior written permission of the author. Copyright © 2007-2023 Bill Luby. All rights reserved.
 
Web Analytics