Showing posts with label Google Trends. Show all posts

Sunday, November 11, 2012

The Rise of Fiscal Cliff Concerns

How much of the recent selloff in stocks has been triggered by media’s sudden obsession with the U.S. fiscal cliff? Is it possible that very little has changed under the surface, but the decibels associated with this issue are now off the charts?

For the last three weeks, VIX and More Fear Poll respondents have rated the issues surrounding the U.S. fiscal cliff as their biggest source of fear about the future of the stock market. Now that the election is behind us and the earnings season is winding down, these fears have been buttressed by a huge amount of media scrutiny suddenly being devoted to the subject.

The fiscal cliff is one of those issues that has been on the horizon for many months, but only recently have investors begun to pay attention to the problem. Part of the reason for this sudden interest in the fiscal cliff is that Congress and the Obama Administration were not going to address the fiscal cliff during the campaign season and consequently no one expected any progress on the fiscal cliff issues during this period. Now that the election is over, the issue is seen as a ticking time bomb, with a much shorter fuse each day.

While politicians, economists and business leaders across the globe have called for a speedy resolution of the fiscal cliff negotiations between Democrats and Republicans, the highly respected Congressional Budget Office added some new urgency to the dialogue with the publication of two new documents on Thursday:

  1. Economic Effect of Policies Contributing to Fiscal Tightening in 2013
  2. Choices for Deficit Reduction

I cannot say that I pay much attention to the likes of CNBC and Bloomberg TV, but I understand that the fiscal cliff issue is now dominating the business television airwaves as well.

All this makes me wonder just how much of the recent selloff in stocks is driven by substance and how much is driven by the media frenzy.

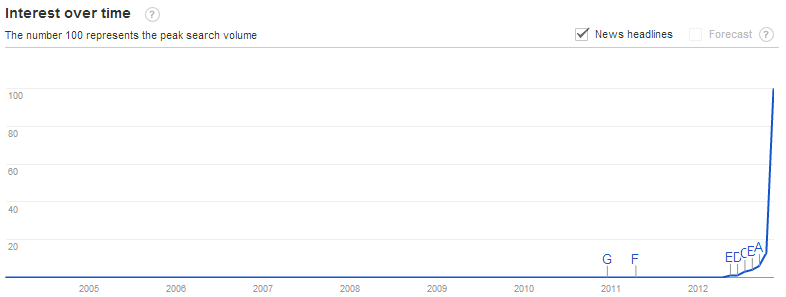
I took a look at the Google Trends data for “fiscal cliff” and discovered that the issue barely registered on Google’s radar until about May of this year.
[source(s): Google Trends]

There was an occasional mention of the fiscal cliff up through last Sunday, then on Monday, the day before the U.S. election, new interest in the subject began to surface. The big spike in interest in the fiscal cliff happened on the day following the election, when Google search volume in “fiscal cliff” rose tenfold and the media frenzy began.
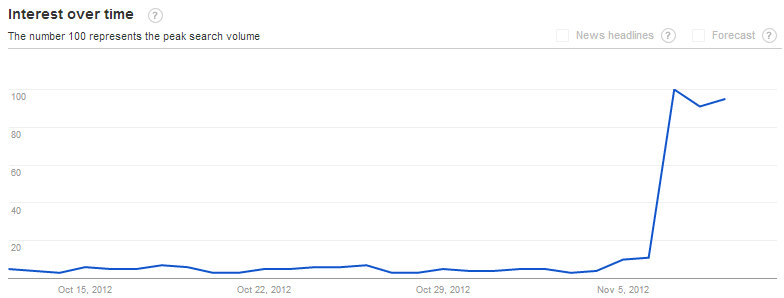
[source(s): Google Trends]

Over the weekend, concerns about the fiscal cliff have been outpolling (voting is still open) concerns about the ongoing European sovereign debt crisis by the largest margin yet. The real question is whether this is due largely to a redirection of attention by the media and by investors or by changes in the underlying nature of the issue or the likelihood of a timely resolution to the problem. My guess is that more of the former is at work than the latter.

Related posts:

Disclosure(s): none

Wednesday, March 3, 2010

Correlation of VIX and “VIX Index” Searches on Google

In retrospect, recognizing only one winner for the chart of the week contest was probably a little short sighted on my part, particularly given the very high quality of the entries.

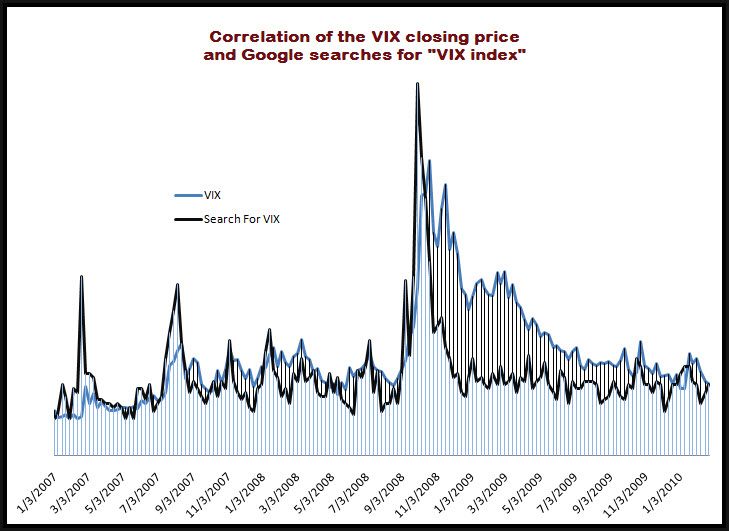
Several readers have asked to see some of the other entries and I am happy to oblige. One of the contenders for the mythical silver or bronze medal certainly would have been a submission from Darren Miller of Attitrade. In the chart below, Darren has compared the level of the VIX with the relative frequency of Google searches for “VIX index” from the beginning of 2007 to the present.

Note that prior to the October 2008 VIX spike, there were more significant spikes in searches for information about the VIX than in the VIX itself. Following the VIX peaks in October and November 2008, the demand for information about the VIX subsided much more rapidly than the VIX index. In fact, according to the graphic, the “VIX index” search activity was back to pre-crisis levels by December 2008, whereas it took the actual index another year to make a comparable drop.

What does this mean? I’m sure Darren and others have their own interpretation, but the chart does bump up against some of the ideas I outlines in my availability bias and disaster imprinting series from last year:

In a nutshell:

“Disaster imprinting refers to a phenomenon in which the threats of financial and psychological disaster were so severe that they continue to leave a permanent or semi-permanent scar in one’s psyche. Another way to describe disaster imprinting might be to liken it to a low level financial post-traumatic stress disorder.”

In reviewing the chart of the VIX against corresponding Google searches, it is possible to conclude that availability bias and disaster imprinting are present in that searches for information about the VIX rapidly reverted to historical norms, while the level of the VIX itself was only gradually reduced over a period of months and months, creating a significant gap between the index and the search activity for almost all of 2009.

For more on related subjects, readers are encouraged to check out:

[source: Darren Miller, Attitrade]

Disclosure(s): none

Thursday, June 11, 2009

Roubini and the VIX

Call me crazy, but lately I have been pondering the sudden disappearance of Nouriel Roubini from the media scene. You could probably add the likes of Meredith Whitney and others to the list of media sensations who rose to fame as a result of successful predictions about the financial crisis and have now been displaced by a different set of pundits who are talking about subjects like green shoots, TARP repayment, and the coming upturn in jobs and housing.

While Roubini’s media star may be setting, the man himself is not slowing down – nor is he backing away from his bearish leaning. Today Roubini is out with Latvia’s Currency Crisis Is a Rerun of Argentina’s and earlier in the week the issue was Green Shoots or Yellow Weeds?

So as I watch the S&P 500 index move above 950, I am thinking about complacency and the possibility of a ‘rebound bubble’ of sorts.

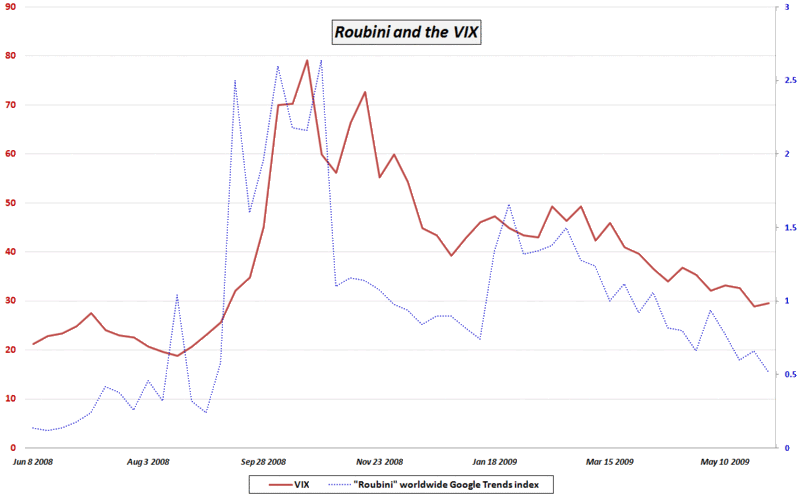
I checked with Google Trends to see what has happened to interest in Roubini and I was not surprised at all to see a chart that resembled that of the VIX. In fact, when I combined the Roubini Google Trends results with the VIX in the graphic below, I was interested to see that interest in Roubini seemed to be a leading indicator of sorts with respect to volatility.

Of course volatility looks as if it may have a stake driven through its heart today, but I am very skeptical that the VIX will be able to drop much below the current 27 level for at least the remainder of the month.

[graphic: VIXandMore]

Disclosure: Long VIX at time of writing.

Tuesday, March 27, 2007

Fun with Technorati and Keyword Trends

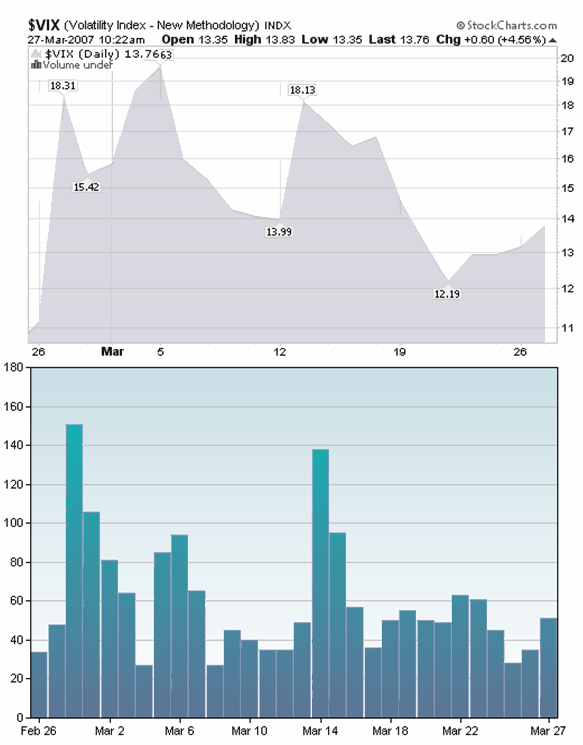
Last week I added a small Technorati chart to this blog in the right hand column, just above the “Recent VIX Readers” widget. As the label indicates, the chart shows the number of posts on all blogs that have included the word “VIX” in them over the past 30 days, as measured by Technorati.

I added the chart largely for informational purposes, but since 30 days have elapsed since the February 27th volatility eruption, I thought it might be interesting to track the use of the word “VIX” in the blogosphere and see how well it correlates with the index itself. Much to my surprise, the correlation is extremely high, with very little lag, as the graph below indicates.

Theoretically, you can do something similar with Google Trends (including slice and dice by region and date,) but if you try to do this with “VIX” the results look much less compelling.

Getting back to Technorati, you can use their own drop down menu parameters at http://technorati.com/chart/VIX?sub=chartlet. You can insert any keyword or keywords you wish, even search for an exact phrase using quotation marks. I suggest starting with something topical like “subprime” and going from there.

If you wish too fine tune this tool by customizing some of the parameters beyond the options available via the drop-down menu, you can edit the URL directly. Techies will probably know how to do this better than I can, but the URL for the basic VIX graph on my blog is: http://technorati.com/chartimg/%28VIX%29?totalHits=12325&size=s&days=30

You can customize some of the parameters as follows:

  • VIX = “any key word(s)”

  • size = y (where y = “s” “m” “l” or “xl”) – I highly recommend “xl” for any analytical work

  • days = zzz (where zzz is any number between 1 and 366) -- unfortunately, I believe this feature is only available for the past year

Contrarians and trend faders, have at it!

DISCLAIMER: "VIX®" is a trademark of Chicago Board Options Exchange, Incorporated. Chicago Board Options Exchange, Incorporated is not affiliated with this website or this website's owner's or operators. CBOE assumes no responsibility for the accuracy or completeness or any other aspect of any content posted on this website by its operator or any third party. All content on this site is provided for informational and entertainment purposes only and is not intended as advice to buy or sell any securities. Stocks are difficult to trade; options are even harder. When it comes to VIX derivatives, don't fall into the trap of thinking that just because you can ride a horse, you can ride an alligator. Please do your own homework and accept full responsibility for any investment decisions you make. No content on this site can be used for commercial purposes without the prior written permission of the author. Copyright © 2007-2023 Bill Luby. All rights reserved.
 
Web Analytics