Friday, March 30, 2012

Why Not Point Hedges?

When most people think of hedges, they think in broad terms like hedging an entire long equity portfolio with SPX/SPY puts or VIX calls or some similar product. The thinking is typically that it is better to have broad-based protection against a bear move in stocks and/or a spike in volatility than to build only one castle wall facing the direction in which an enemy attack is expected. More often than not, it is the unexpected that wreaks havoc on a portfolio, not the white swan that slowly morphs into ivory, then light gray, then…

I might as well say this up front: I hate hedges. I love the idea of hedges, but when it comes time to pay for one, they invariably come across as more expensive than even a reasonably effective market timing strategy. Of course, there are all kinds of hedges, from those that are limited to disaster protection insurance to those that are intended to counteract even the slightest nick to a portfolio. If I feel like I can get my hedges at a discount (Groupon, are you listening?) then I will gladly ante up and enjoy the safety net.

Now there are some out there who think that some of the risks to stocks, particularly domestic equities, are being exaggerated by most investors. Those who hold this opinion might be better served to avoid a broad-based hedge and think in terms of what I call a point hedge. Simply stated, a point hedge is a rifle approach to portfolio protection rather than a (full perimeter) castle wall approach.

Perhaps an example will help to illustrate the point hedge approach. Let’s assume that an investor thinks that the U.S. economy will do better than the doomsayers predict and even fulfill James Altucher’s prediction, which was far-fetched at the time, that the SPX will hit 1500 in relatively short order. If that’s the case, then should the rifle be aimed? Let’s further assume that this bullish investor is primarily concerned about a worsening conflict between Iran and Israel, Spanish fiscal issues starting to resemble the Greek crisis, a possible hard landing in China and the rise of cyberwarfare.

Rather than construct a broad-based hedge, it is possible to create a more cost-effective portfolio hedge by aggregating point hedges across all four areas of concern. For Iran and Israel, something like a long position in Brent crude oil (BNO) might do the trick. As far as Spain is concerned, purchases of puts in the country ETF (EWP) would be appropriate, but a more liquid and perhaps more targeted approach might be long puts in Spain’s largest bank, Banco Santander (STD). There are many alternative approaches in China, but certainly a short position in FXI or some long puts in that ETF is one approach worth investigating. Last but not least, cyberwarfare presents a different set of problems, but some of the firms where call purchases might be hedges against a spike in cyberwarfare are SAI, CHKP, FIRE, FTNT and SYMC.

Of course this is just one of many potential list of threats to the stock market and possible point hedges that might be used to counteract them. Even if you prefer the blanket coverage of a broad-based hedge, it is usually worth the time and effort to draw up a list of potential threats and stocks/ETPs that might be employed to counteract those threats or perhaps even provide some speculative gains.

On a related note, I realize that I have only periodically been applying the “hedging” label to my posts, so I reviewed quite a few posts in the archives and have begun to retroactively apply that label to those posts (such as several in the list below) which might be of particular interest to financial archeologists.

Related posts:

[graphic: Scaliger Castle, Sirmione, Italy – Library of Congress]

Disclosure(s): long FIRE at time of writing
Thursday, March 29, 2012

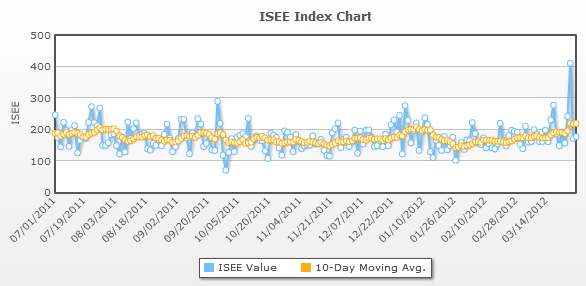
New Single Day High in ISEE Equities Only Index on Monday

Lost in all the hoopla over the VelocityShares Daily 2x VIX Short-Term ETN (TVIX) was a historic event in the options and market sentiment world on Monday: a new single day high in the ISEE equities only call to put ratio.

To recap for those who may not be familiar with the ISEE, this ratio was developed by the International Securities Exchange (ISE) and is calculated by dividing opening long call options bought by ISE customers by opening long put options bought by ISE customers, then multiplied by 100. The ‘equities only’ slice of the full transaction pie means that all trades with indices and ETPs are excluded from this data, which also reduces the likelihood that any of the ISEE equities only data includes trades intended largely as portfolio hedges.

Monday’s record close of 410 means the ISE customers were buying four times as many calls as puts. Because there tends to be a lot of noise in the daily data, I like to average the data over a 10-day period. The chart below shows the ISEE equities only index since July 2011, along with the 10-day moving average.

Generally, put to call data is considered to be a contrarian indicator that flags when the masses are becoming overly exuberant or fearful and on Monday at least, exuberance – rational or otherwise – was running rampant, perhaps over the excitement of growing evidence of possible QE3 activity and a Bernanke put in general.

For what it is worth, the prior single day high in the ISEE equities only index dates from December 2010, when stocks were in the middle of a six-month bull move that resembles the current move in several respects and carried the SPX from 1039 to 1344.

Related posts:

[source(s): International Securities Exchange]

Disclosure(s): short TVIX at time of writing

Another Spike in VXX Volume

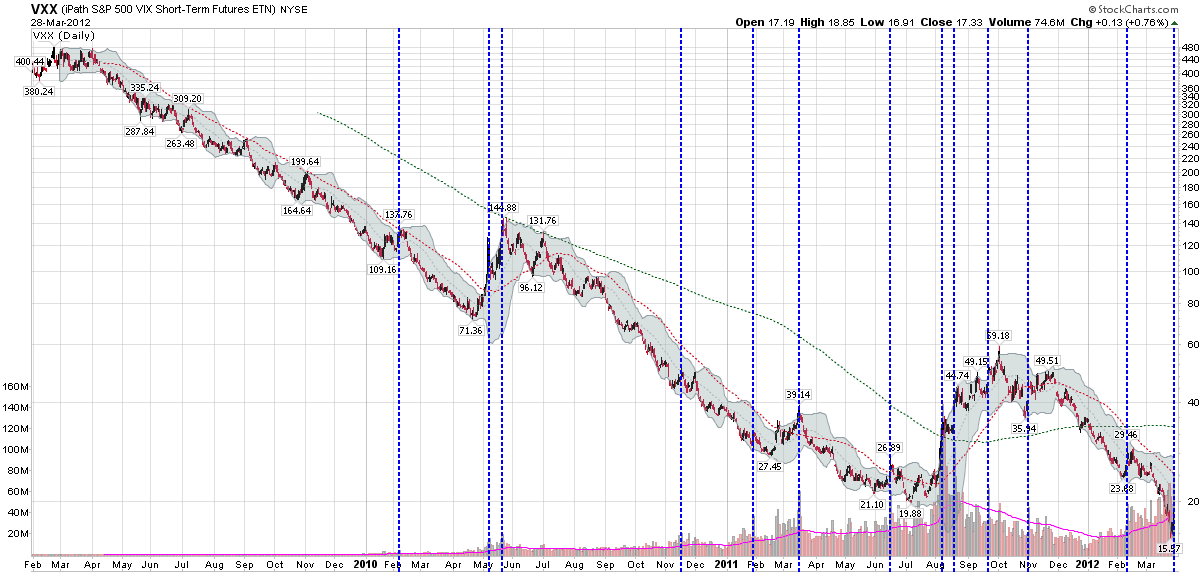
Looking the history of the volume spikes in the iPath S&P 500 VIX Short-Term Futures ETN (VXX) is a lot like looking at the history of market sentiment, contrarian thinking and psychology.

Since its launch in January 2009, VXX has been responsible for luring in unwary investors with its siren song promise of huge profits ahead of the next, inevitable, just-around-the-corner selloff in stocks. Unfortunately for VXX longs, the hoped for VIX spike usually turns out to be much more elusive than anticipated and investors who fail to tie themselves to their masts typically end up shipwrecked on the treacherous shore of complacency.

A glimpse at the biggest volume spikes in the history of VXX (see chart below) shows that almost all of these happen at near the top of a VIX spike and leave longs exposed to a sharp downturn. The notable exceptions are largely limited to last August, when a surge in VXX trading volume accompanied the first leg up of what turned out to be a multi-stage rally in the VIX and VXX.

If history is any guide, the current VXX volume spike (with 75 million shares traded yesterday, the only stock that traded more shares was BAC) is likely to turn out to be some combination of wishful thinking and an overreaction to yesterday’s mini-spike, when the VIX traded over 17.00 for the first time in thirteen sessions. Then again, history has not been a very good guide for the last few years and triskaidekaphobics in particular should always prepare for the worst…

Related posts:

[source(s): Stockcharts.com]

Disclosure(s): short VXX at time of writing

Tuesday, March 27, 2012

VXX, VXZ, XIV and ZIV During Eleven Months of a Sideways VIX

The VIX closed at 15.59 today, just 0.03 points lower than the close of 15.62 on April 26, 2011, some eleven months ago.

From a long-term perspective, not much has happened with the VIX, but for those who have ridden the volatility roller coaster up and down, the present time seems like an excellent opportunity to reflect on where the ride has taken us.

For those who have traded VIX exchange-traded products (ETP) during the last eleven months, the ride has been much different than that of the VIX itself, an issue I highlighted in VIX Exchange-Traded Products: The Year in Review, 2011, when I concluded, “While it is interesting that both the long and short volatility ETPs were unable to turn a profit for the year, there were stretches during 2011 that various VIX ETPs produced extraordinary gains.”

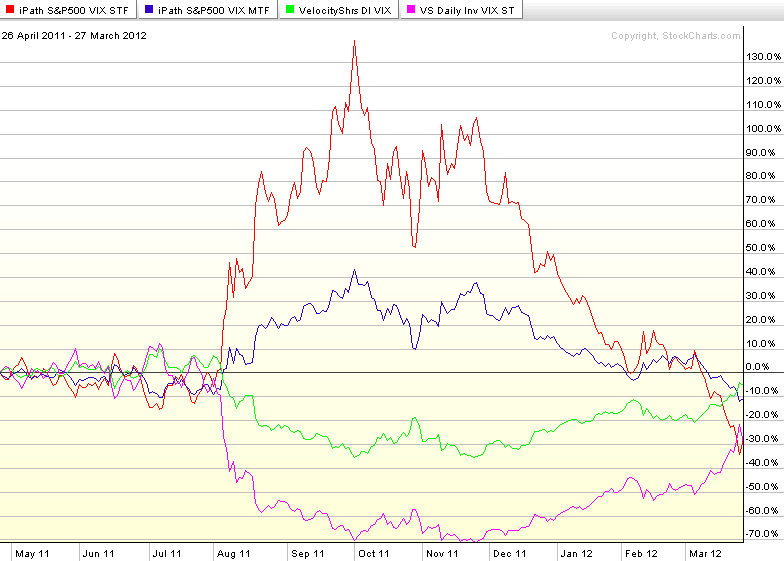
In the graphic below I have highlighted the performance of four popular VIX ETPs that are the most actively traded issues among the several that occupy a competitive space with a similar leverage factor and weighted average maturity (see Slicing and Dicing All 31 Flavors of the VIX ETPs for additional details):

  • VXX – iPath S&P 500 VIX Short-Term Futures ETN (red line)
  • VXZ – iPath S&P 500 VIX Mid-Term Futures ETN (blue line)
  • ZIV – VelocityShares Daily Inverse VIX Medium-Term ETN (green line)
  • XIV – VelocityShares Daily Inverse VIX Short-Term ETN (violet line)

Note that while the VIX traded sideways, all four VIX ETPs lost money, with the worst losses being incurred by VXX, which was down 28% during this period.

Not surprisingly, the two ETPs with the five-month target maturity (VXZ and ZIV) were considerably less volatile than their one-month target maturity counterparts.

There are a number of potential takeaways here, but perhaps the biggest of these is that VIX ETPs will struggle to outperform the VIX over longer-term time horizons. For these trades to be profitable, proper market timing is of the essence, as is the ability to take profits and/or cut losses when the trade starts to move sharply in the wrong direction.

Related posts:

[source(s): StockCharts.com]

Disclosure(s): long XIV and ZIV, short VXX and VXZ at time of writing

Options on UVXY and SVXY Open Up New VIX ETP Trading Approaches

Whether or not I find it useful to flog the wounded horse otherwise known as the VelocityShares Daily 2x VIX Short-Term ETN (TVIX), it seems as if investors and the media insist that the wild and crazy story of this +2x VIX futures ETN remain on the front page for now.

While the TVIX story is indeed a fascinating one (see links below for more details), I fear it has crowded out a potentially more useful development from last week that has been criminally overlooked, the launch of options on two important VIX ETFs:

  • ProShares Ultra VIX Short-Term Futures ETF (UVXY)
  • ProShares Short VIX Short-Term Futures ETF (SVXY)

First off, note that the fact that these two products are exchange-traded funds instead of exchanged-traded notes means that it was much easier for options to be approved. While their more famous ETN counterparts, TVIX and XIV, grab most of the headlines, the addition of options means that traders now have much more flexibility in terms of strategy and tactics with UVXY and SVXY. 

In the past when I have mentioned how options on VIX ETPs were critical to their long-term success, I was met with a few (electronic) blank stares. Part of this reflects that fact that many have been drawn to the VIX ETPs for the potential to reap huge profits in a short period of time (more on this in The Trader Development Stage Model and the Jump from Stocks to Options) with leveraged trades. Talk to most professional options traders, however, and leverage is rarely a factor they mention as a reason for their focus on options trading. In fact, pros are more likely to cite the two key advantages of options as their flexibility and ability to structure defined risk (or limited risk) trades.

This brings me back to options on UVXY and SVXY. With UVXY down 83% for the quarter as of yesterday’s close, one would think that defined risk positions – on the long or short side – would be a critical factor in structuring future trades. With the huge contango and negative roll yield currently in the VIX futures, a directional bet in either direction entails huge risk. For shorts, this means that a short position can have its risk capped by buying UVXY calls. For longs this means that a long position can also limit risk by buying puts.

There are other ways to implement defined risk trades, notably with vertical credit spreads and vertical debit spreads, where gains and losses are limited to the distance between strikes. Traders can also just simply buy puts and calls to put a directional idea to work, knowing that their maximum loss will be limited to the purchase price.

In hard to borrow situations – which are common with some VIX ETPs – traders can also use options to create a synthetic position. For instance, a long put plus a short call is the equivalent of a synthetic short, so if no shares are available to borrow, a synthetic position might be an excellent proxy, with the same profit and loss potential as a standard short position, yet typically tying up a lot less trading capital.

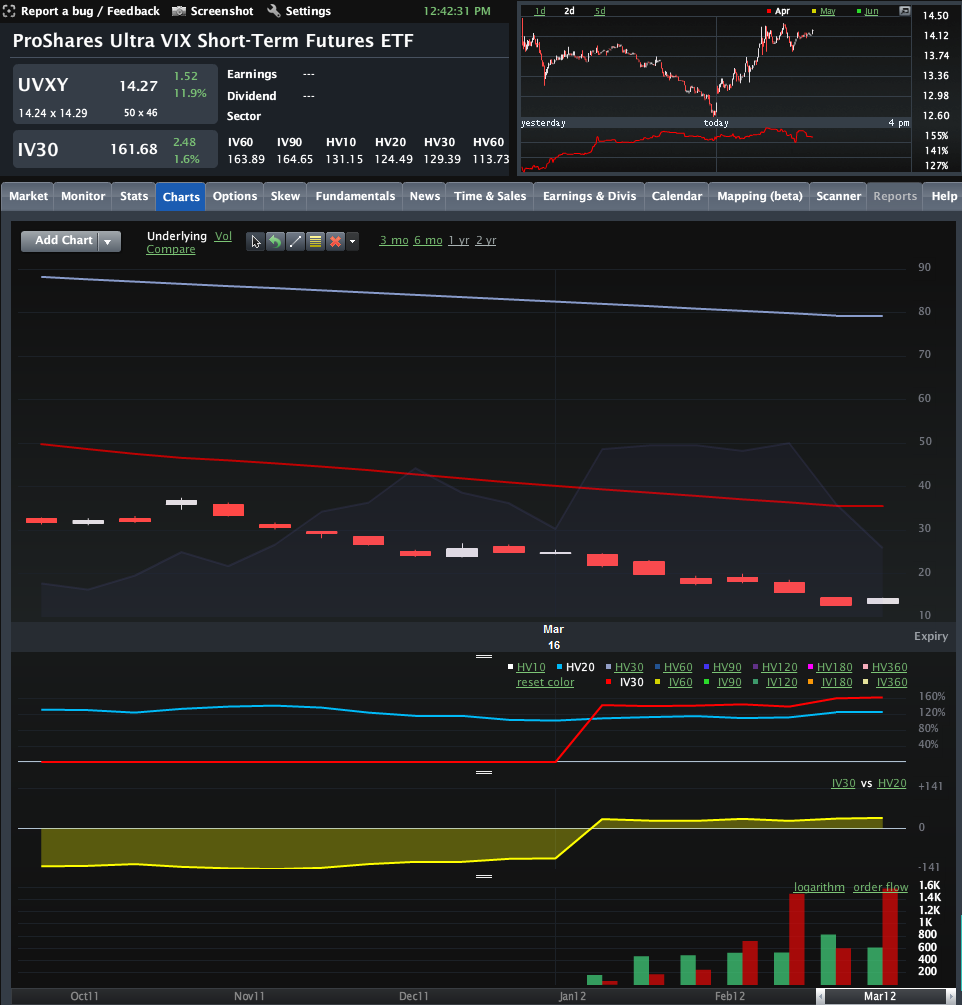
Note that the markets for options in UVXY and SVXY are only one week old and not particularly liquid at this stage. On the other hand, volumes are ramping up quickly (see graphic of UVXY options volume, etc. below) and the flexibility and risk control inherent in options products makes these attractive, particularly so when applied to highly volatile products like UVXY and SVXY.

Related posts:

[source(s): LivevolPro.com]

Disclosure(s): long XIV and SVXY, short TVIX and UVXY at time of writing; Livevol is an advertiser on VIX and More

Monday, March 26, 2012

Q&A: VXX Declines, Yet April 20 Calls Rise

A reader asked earlier today:

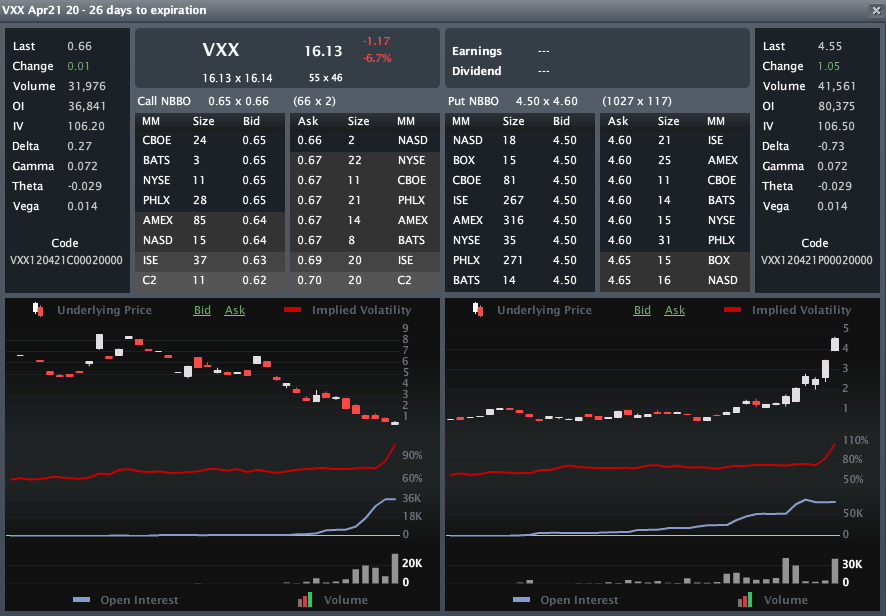
Can you explain to a newbie why VXX is down 1.05 today yet the April 20 calls are up .05?

This is a great question and one which I receive in one form or another on a regular basis.

While there are a number of variables that go into the price of an option, in the short-term the factors which have the biggest influence on the changes in the price of an option are typically:
1)  the change in the price of the underlying
2)  the change in the option’s implied volatility

Since we know from the question that VXX is down today (and down even more from the time the question was asked) this almost certainly makes implied volatility the culprit.

Rather than speculate, I pulled up the graphic below from LivevolPro which confirms that in the case of the VXX April 20 calls, implied volatility (IV), which is shown as a solid red line (VXX April 20 call on the left, April 20 put on the right), jumped from 84 on Friday to over 106 today.  For some historical perspective, the IV had been stuck in the 70s for more than a month prior to Friday, at which point it increased from 75 to 84.

This should serve as a reminder for those who are relatively new to options and are attracted to the possibility of making large amounts of money on directional trades that guessing the direction of the price move is not sufficient for making a profitable directional trade.  In addition to getting the direction right, an options trader has to be cognizant of changes in implied volatility as well as the impact of time decay, aka theta.

For those not familiar with the specifics of options pricing models, the Black-Scholes entry at Wikipedia is a good place to start.

Related posts:

[source(s): LivevolPro.com]

Disclosure(s): short VXX at time of writing; Livevol is an advertiser on VIX and More

Thursday, March 22, 2012

TVIX Creation Units Return; What It Means for Investors

One month and one day after Credit Suisse (CS) announced the suspension of new creation units in the VelocityShares Daily 2x VIX Short-Term ETN (TVIX), the issuer announced today that it plans to reopen issuance of TVIX “on a limited basis” effective tomorrow.

In a twist, the press release also noted:

“Beginning March 23, 2012, Credit Suisse may from time to time issue the ETNs into inventory of its affiliates to make the ETNs available for lending at or about rates that prevailed prior to the temporary suspension of issuances of the ETNs. Also, beginning as soon as March 28, 2012, Credit Suisse may issue additional ETNs from time to time to be sold solely to authorized market makers. Credit Suisse may condition its acceptance of a market maker’s offer to purchase the ETNs on its agreeing to sell to Credit Suisse specified hedging instruments consistent with Credit Suisse’s hedging strategy, including but not limited to swaps. Any such hedging instruments will be executed on the basis of the indicative value of the ETNs at that time, will not reflect any premium or discount in the trading price of the ETNs over their indicative value and will be on terms acceptable to Credit Suisse, including the counterparty meeting Credit Suisse’s creditworthiness requirements, margin requirements, minimum size and duration requirements and such other terms as Credit Suisse deems appropriate in its sole discretion.” [emphasis added]

The references to hedging instruments consistent with Credit Suisse’s hedging strategy, swaps, counterparty creditworthiness, margin requirements, etc. may shine a light on some of the issues that Credit Suisse encountered when they elected to close the creation unit window last month.

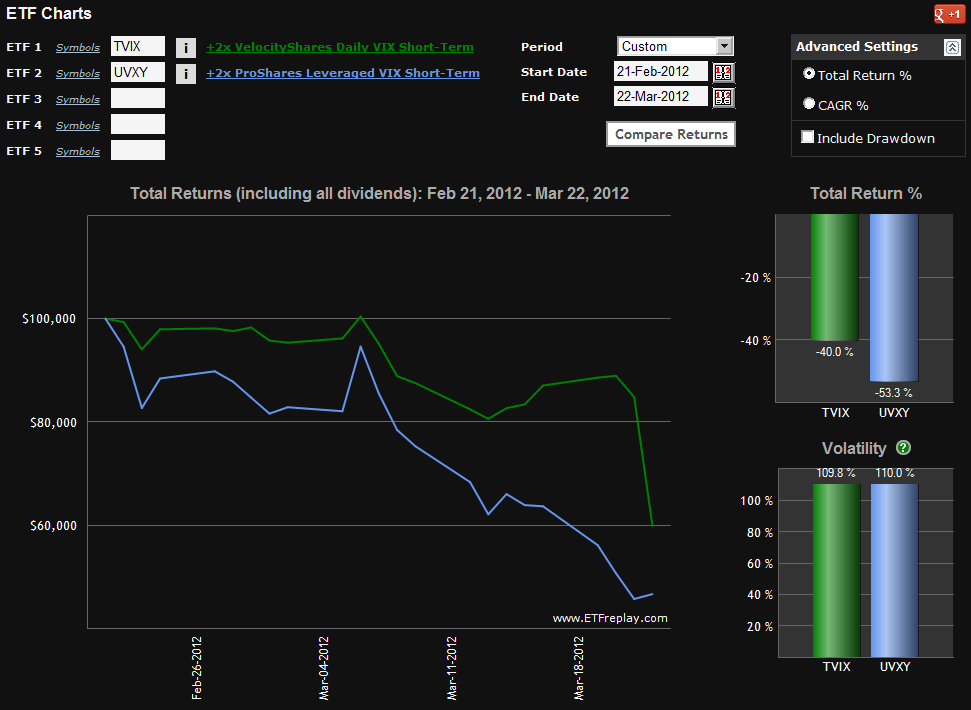
Today’s price action has already raised some eyebrows, with TVIX falling 29.3% during the regular trading session and dropping another 11.8% after hours, while a near equivalent security, the ProShares Ultra VIX Short-Term Futures ETF, UVXY, rose 2.1% during the standard session and was essentially unchanged after hours. As best as I can determine, news of the reopening of the creation units window broke at about 7:34 p.m. ET, at which point TVIX was already down more than 33% from Wednesday’s close. Given that the 30 million shares traded today was about as many shares as had exchanged hands in the prior week, it is reasonable to conclude that at least one party believed that new creation units were imminent and had hoped to profit by shorting TVIX ahead of the announcement. In fact the price action of TVIX was so disconnected from UVXY and the rest of the VIX ETPs that I fielded dozens of questions on the subject and concluded (Twitter, blog comments), “The continued decline in TVIX has me wondering if someone is speculating about CS re-opening the creation units window.”

Of course investors are more interested in what will happen next than what flotsam has already drifted under the bridge.

As for tomorrow’s open, first keep in mind that TVIX ended today’s after-hours session at 9.00, while indicative value is still a good deal lower at 7.83. While Credit Suisse would no doubt like to see TVIX trade back at indicative value levels as soon as possible, the “on a limited basis” phrasing is likely to give some investors pause. Also, there are no guarantees that Credit Suisse might not feel compelled to suspend creation units again at some point in the future. For this reason, I would not at all be surprised to see TVIX continue to trade with a premium in the neighborhood of 5-10% or so at times tomorrow, dropping down to something along the lines of 2-5% next week. These numbers are pure speculation at this stage. A large part of the premium story will depend upon how limited the new creation units are and how aggressively Credit Suisse seeks to drive down the market price to the indicative value. No matter how this plays out, investors should expect that at least 90% of the divergence between TVIX and UVXY over the last month (see graphic below) will disappear tomorrow.

On a related note, investors who have become wary of TVIX during the past month have embraced UVXY to the extent that UVXY’s daily dollar volume has been running ahead of that of TVIX during the past week.  As of Monday, UVXY also has the benefit of being supported by options, with April strikes from 14 through 35 already seeing a fair amount of action. With the advents of options on UVXY (and also on the -1x inverse VIX futures ETF, SVXY) a new universe of trading opportunities becomes available for those who wish to speculate or hedge with VIX-based ETPs. What is most encouraging is that investors can now easily trade VIX products with defined (limited) risk positions by utilizing options. More on this at a later juncture.

In the meantime, [T]VIX and More will do its best to cover the TVIX story as it continues to develop.

Finally, I would be remiss in failing to point out that this space was the only place that one could find information about TVIX before and during the suspension of the creation units. The links below, which are arranged largely in reverse chronological order, provide a wealth of information about TVIX, UVXY and many of the issues facing these products.

Related posts:

[source(s): ETFreplay.com]

Disclosure(s): short TVIX and UVXY at time of writing

The IMOS Saga, Cramer and Options

I must admit that when I first posted about ChipMOS Technologies (Bermuda) LTD (IMOS) two weeks ago, it never occurred to me that there might be a follow-up post and certainly not two more chapters to the story, yet here we are.

For a while it looked to me like the spike in IMOS had run its course on Tuesday, right about the time I wrote IMOS Up 54% in Two Weeks; IV Still Lags HV. By the end of that day, the stock was in the midst of apparently finding some post-pullback equilibrium in which the wild price action could devolve into some sort of consolidation.

That scenario received a modest jolt last night when a caller asked Jim Cramer during Cramer’s ‘Lightning Round’ feature for the Mad Money maven’s opinion on IMOS. Now I thought Cramer had never met a stock he didn’t have an opinion on, but apparently the gist of his response was that he would have to do some research before he provided some commentary and a thumbs up or down.

Of course we have no way of knowing what sort of take Cramer might have on IMOS, but already one Seeking Alpha contributor has stepped up to make the bull case in Jim Cramer – Here’s What You Need to Know About ChipMOS.

Regardless of what Cramer decrees, he is bound to generate some additional interest in IMOS. If history is any guide, his commentary has a good chance of substantially moving the stock.

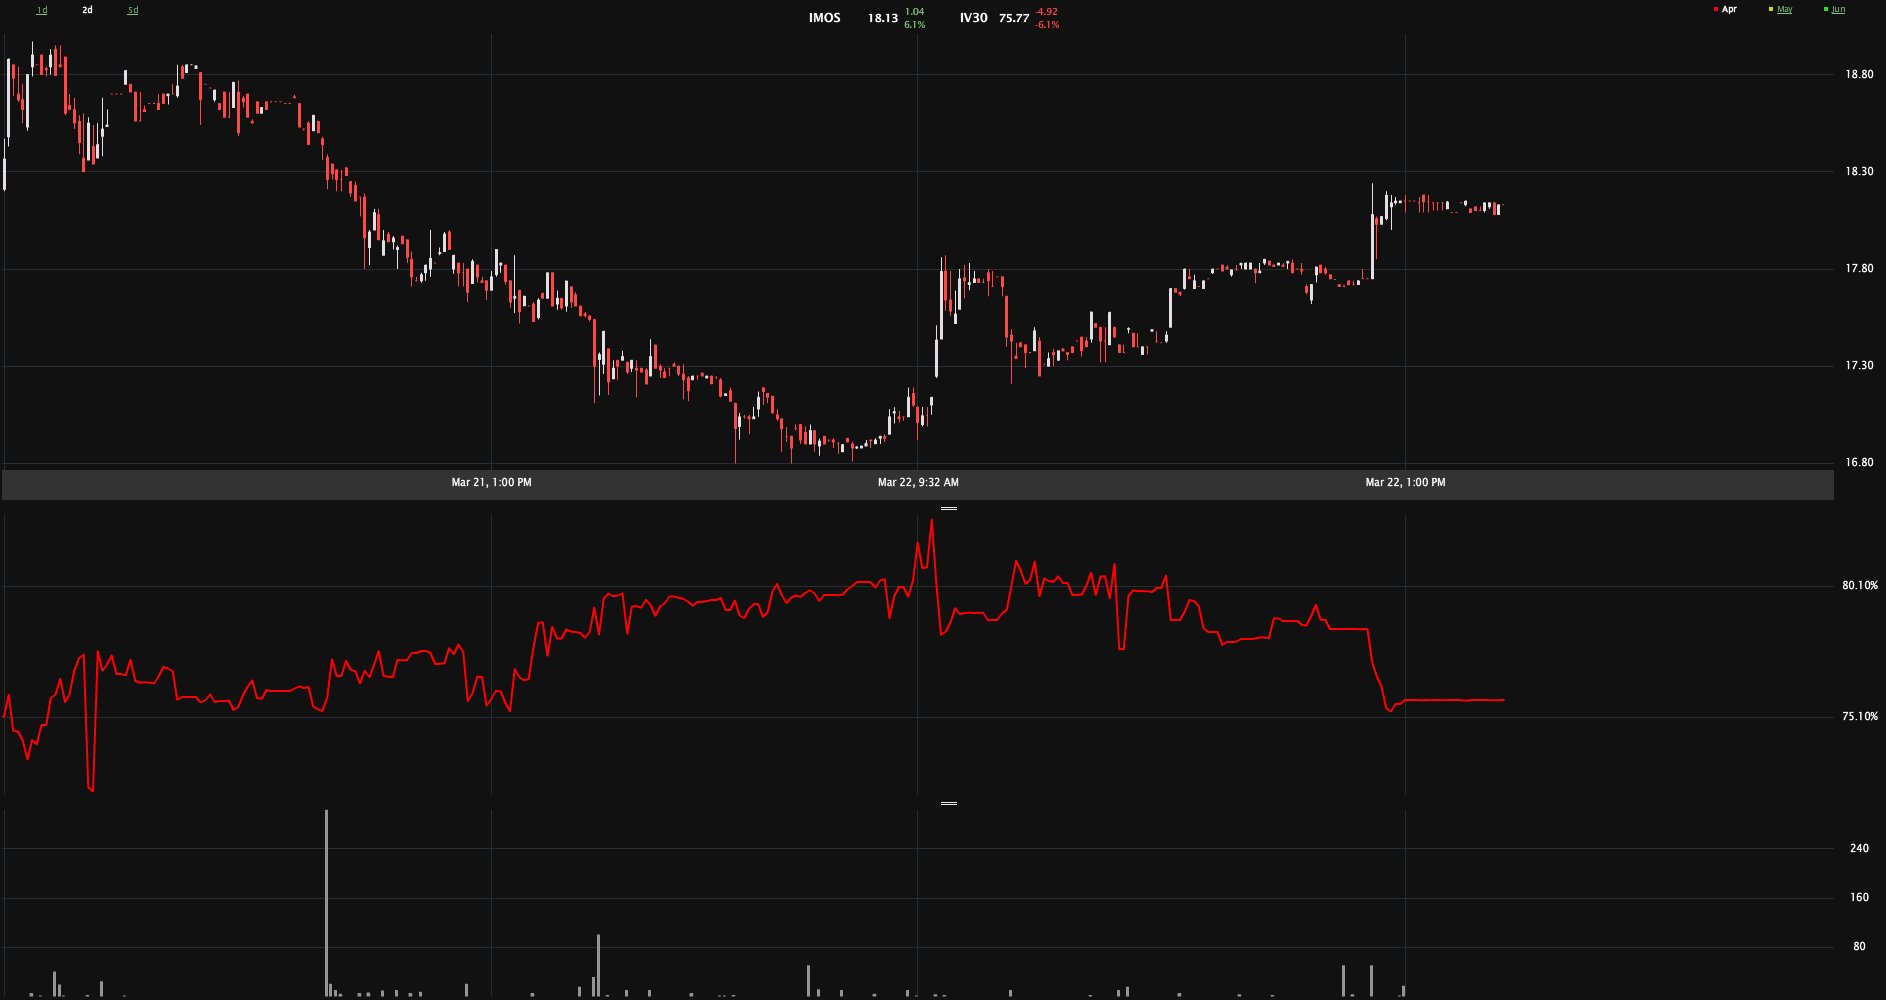
All this brings me back to my initial post, IMOS Breaks Out, But Implied Volatility Fails to React. Even if the prospect of Cramer weighing in might not necessarily have a directional impact on the stock, you would think that options investors might treat the upcoming Cramer pronouncement (and I am assuming he will follow through on his promise to offer an opinion) as likely to trigger an increase in volatility. Much to my surprise, however, IMOS’s 30-day implied volatility is down 6.1% today and currently sits 17 points below the comparable 20-day historical volatility. The two day price and implied volatility chart below shows that while IV did spike right after today’s open, it has since been trending down.

As was the case two weeks ago, once again I suspect that IV is understating the future movement in this stock, but this time around I am going to be a spectator rather than a participant. Someone out there, however, should be enjoying this ride.

Related posts:

[source(s): LivevolPro.com]

Disclosure(s): Livevol is an advertiser on VIX and More

Wednesday, March 21, 2012

The Dangers of Anticipating a Market Reversal

Raise your hand if you are anticipating a bearish reversal in stocks in the near future. Great. Lots of hands here... Now let’s be honest, how many were also expecting a reversal a week ago? a month ago? ever since the calendar turned to 2012?

Market reversals are notoriously difficult to predict, which is part of the reason why many successful investors stick exclusively to trend following strategies. If one bets on a market reversal such as a correction during a bull market and it doesn’t happen, not only is there a loss associated with a short position, but there is also the opportunity cost of not having participated in the rally.

The worst part of trying to anticipate a market reversal, however, can be the psychological damage. If an investor thinks that a market is overbought or overvalued, then gets short and covers that short after the market continues to rise, they often subsequently have to wrestle with a mental block that makes it even harder to get long in a market that now appears to be even more overbought/overvalued.

So what is a savvy investor to do when he or she believes that stocks have risen too far too fast?

One approach is a stock replacement strategy. This approach consists of selling existing long holdings and replacing these with equivalent long call positions (1 contract for every 100 shares held.) A stock replacement strategy allows an investor to participate in any subsequent bullish moves, yet limits losses to the cost of the options purchased. While all stocks and other securities do not have options associated with them, there are always index options and options on a wide range of exchange-traded products (ETPs) available that are close approximations for the original holding.

For investors who think stocks are more likely to tread water than correct sharply, covered calls (or buy-write strategies) are an appropriate strategic choice. Here there are ETPs which can execute such strategies, the most popular of which is the PowerShares S&P 500 BuyWrite Portfolio ETF (PBP).

A third approach might be to rotate into less volatile holdings such as the popular PowerShares S&P 500 Low Volatility Portfolio ETN (SPLV).

Investors who are looking to hedge their existing long equity positions without rotating into options, covered calls or low volatility holdings might want to review my recent Dynamic VIX ETPs as Long-Term Hedges, which focuses on VQT and XVZ.

Quite a few talented investors have missed out on the 2012 rally and despite what you hear on CNBC or read in your favorite financial publication, there is no guarantee we will get a big pullback anytime soon. In the meantime, there are a number of approaches that will allow investors to benefit from any continued bull moves, while minimizing downside risk. In addition to some of the approaches outlined above, the links below should be a good source of information for explaining some alternative approaches as well as the nature of the recent market moves.

Related posts:

Disclosure(s): long PBP and XVZ at time of writing

Tuesday, March 20, 2012

IMOS Up 54% in Two Weeks; IV Still Lags HV

ChipMOS Technologies (Bermuda) LTD (IMOS), is up 54% in two weeks and slightly less than that in the 12 days since I mentioned the stock in IMOS Breaks Out, But Implied Volatility Fails to React.

While the company did report earnings last Friday, the stock did not appear to have an immediate reaction to that report. After trading in a wide range on Friday, the stock closed up 1.5%. Yesterday, however, it was off to the races again, with the stock up another 14%.

Part of what makes IMOS intriguing is the paucity of public information associated with this Taiwan-based company. As a result, the stock is highly responsive to technical factors and also has a high emotional component associated with the price action.

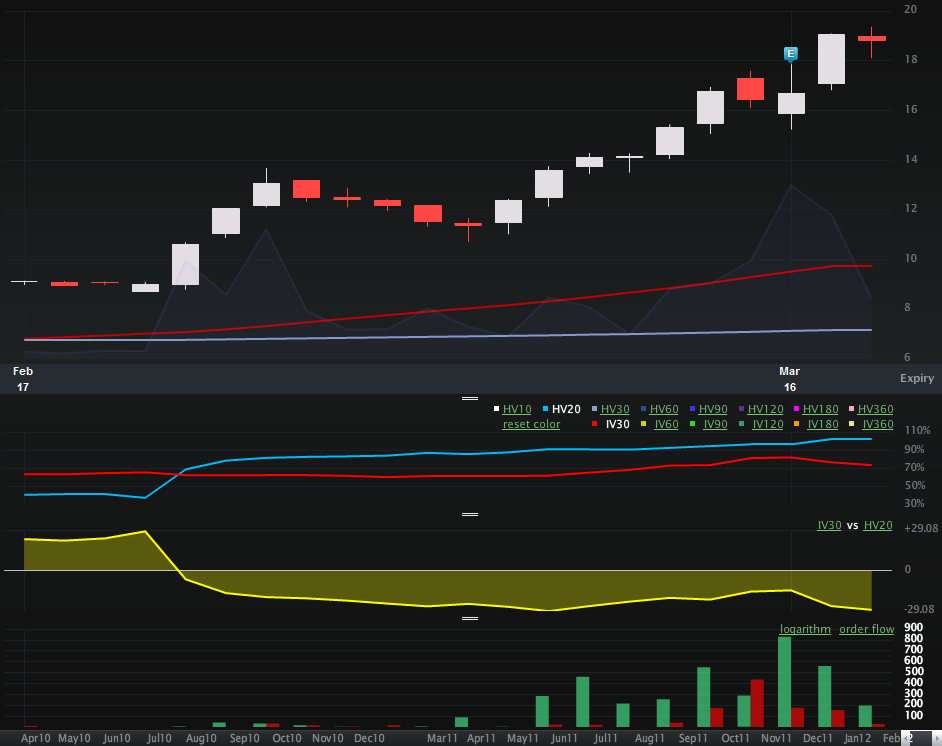
The last time around I posted about IMOS largely because I thought it was interesting that a stock which was breaking out ahead of earnings had such low implied volatility (red IV 30 line) in spite of the fact that IMOS was now apparently “in play” at least in the minds of some investors. I commented at the time that “the current HV 20 of 91 is a better estimate of future volatility than the current IV 30 of 62.”

A little less than two weeks later, some interesting things have happened. In the one month chart below, once can see that IV 30 has risen to 75, even after accounting for the 10% decline following the earnings announcement. With historical volatility (blue HV20 line) now at 102, implied volatility still looks like a conservative estimate of the potential future moves in IMOS, particularly when one considers that daily trading volumes are now running at about five times the three month average.

Options volume has also picked up dramatically and almost all of the action has been on the call side.

In terms of trading, this is the type of freight train that I generally prefer not to step in front of, but having closed out my long positions, I now find that there are a couple of defined risk trades on the short side that have some potential.

Related posts:

[source(s): LivevolPro.com]

Disclosure(s): short IMOS at time of writing; Livevol is an advertiser on VIX and More

Wednesday, March 14, 2012

Third Steepest First-Second Month VIX Futures Contango Ever

For a variety of reasons, investors seem unwilling to embrace the current rally and with each day the market rises, I see a scramble in the indicator forest to find some sort of proof that stocks are finally, inevitably going to correct…and soon. I need to give this phenomenon a name, so I am going to call it indicator hunting and define it as a companion to confirmation bias.

I discussed this subject a little over a month ago in What the VIX Kitchen Sink Chart Says (it hasn’t said much lately, but I’m trying to teach it sign language), when I noted:

“One of the more interesting developments of 2012 has been to watch the diminution of the strident bearish narrative that has been focused largely on the collision course between a preponderance of debt and low or negative growth. The bullish beginning to 2012, however, has not prompted many in the way of converts to the bullish camp. Instead, there have been whispers of ‘…overbought…’ that have turned into a soft murmur and are now verging on becoming loud chorus. Suddenly the general consensus seems to be that stocks just do not deserve their current lofty valuation.

In this type of environment, many investors become particularly susceptible to confirmation bias and scramble to find one or more indicators which will tell them what they have already begun to believe: that a major correction is likely just around the corner.”

Not surprisingly, the clamoring has only become more strident as stocks have continued to rise.

One of the current targets of indicator hunting is the huge contango in the VIX futures term structure. Some are saying it is steeper than it has ever been before (it isn’t) and others are convinced that this means the presumably omniscient SPX options traders are foretelling something between a steep selloff and a market crash just around the corner.

While selling fear is a proven media strategy and sometimes an attractive investment strategy, I submit that these pundits are giving SPX options traders too much credit and are substantially off the mark in their analysis.

In next week’s issue of Expiring Monthly: The Option Traders Journal, I analyze the VIX term structure as a predictor of future changes in stocks and volatility. Let’s just say that, at a minimum, that these same pundits are going to be surprised by the results.

To illustrate my point, consider that yesterday’s close marked the third steepest contango reading for the first and second month VIX futures. The chart below highlights the first and second steepest (front month and second month) VIX futures contango readings on record, which date back to July 2004, some 3 ½ months after the CBOE launched VIX futures. Looking at the chart, those two consecutive days appear almost to have been selected at random, coming at a time in which the SPX was 3.5% below a high from two weeks earlier and four weeks prior to a cycle low that would see the SPX decline another 4.2%. In the bigger picture, however, the record VIX futures contango came at a time when stocks were taking a breather before embarking on another huge bull leg. Ironically, the VIX was also hovering at about 15.00 when the VIX futures contango established the record, but five months later it would be trading in the 11s and one year later we even saw a sub-10 VIX.

Now I would be foolish to rule out the possibility of another sharp pullback, but I think it is even more foolish to stubbornly stick to preconceived notions, ignore the market action and confirmation bias and indicator hunting (perhaps even availability bias and disaster imprinting as well) drag down your portfolio.

Related posts:

[source(s): StockCharts.com]

Disclosure(s): the CBOE is an advertiser on VIX and More

Tuesday, March 13, 2012

A VIX of 15!?! Meet the New Reality

When the VIX recently slid below 20.00 for an extended period, I sensed a noticeable unease about the state of the market in many traders and investors. Clearly a sub-20 VIX was underestimating the risks in the current and future market environment, they thought. When the VIX dipped below 18.00 that unease intensified and now with the VIX hovering around the 15.00 range and I can sense that quite a few are ready to grab the nearest pitchfork and riot about the inhumanity of the wayward VIX.

I will be the first to admit that there are a number of perplexing geopolitical, macroeconomic and other factors that pose real threats to the economy and to stocks, but I also believe that investors have become so fixated on some of the past problems that availability bias and disaster imprinting has clouded their judgment to the extent that they cannot separate the current market environment from the ghosts of markets past.

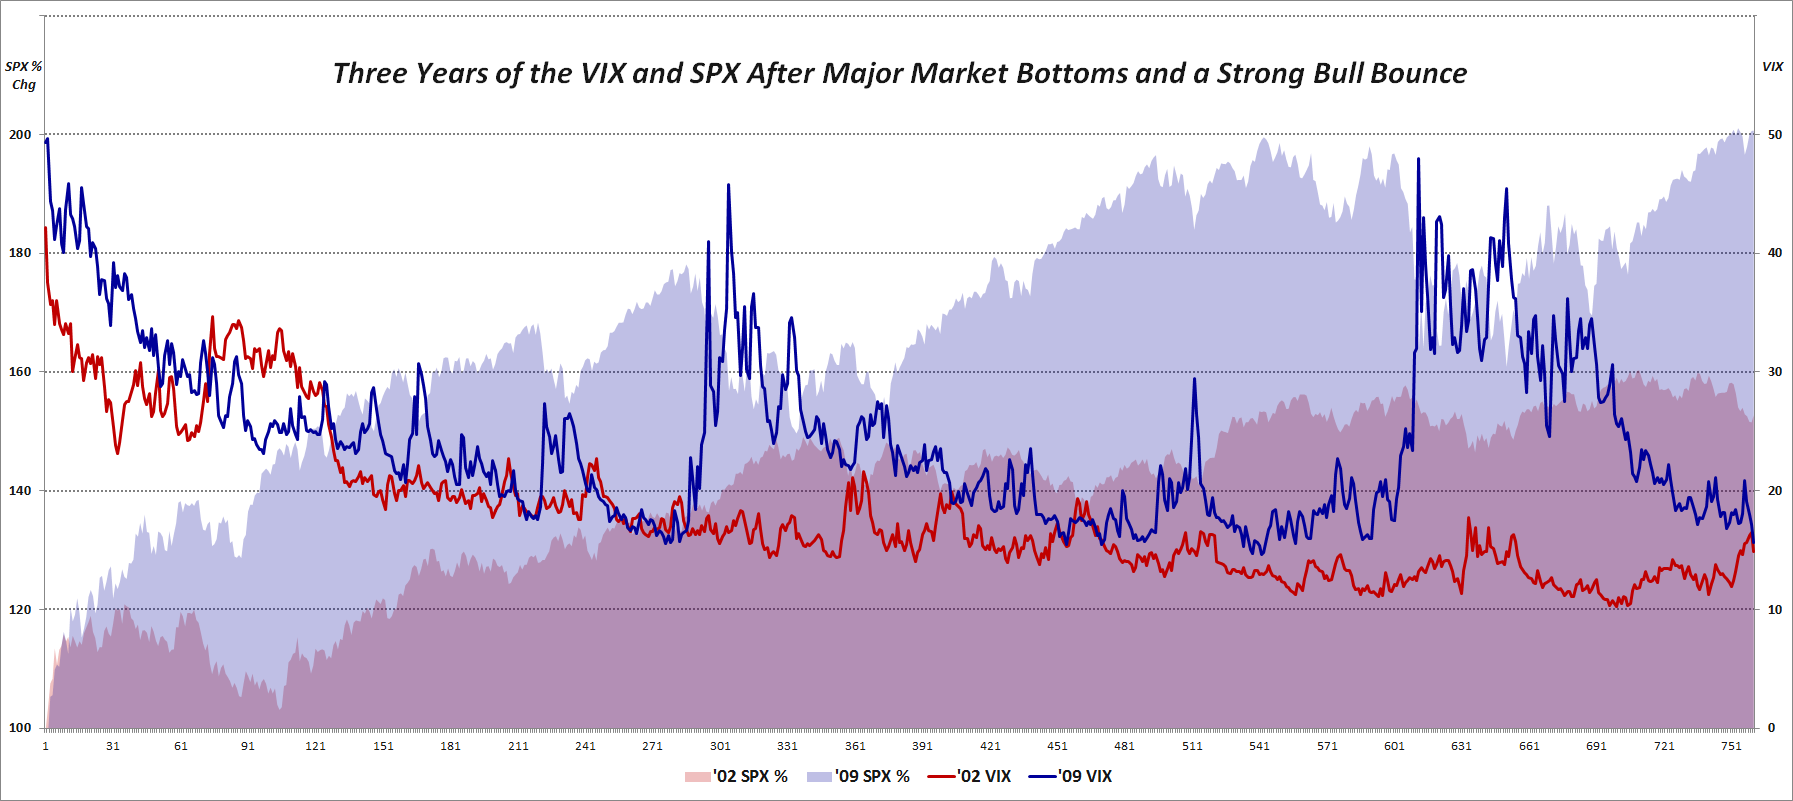
With this in mind, I created a chart to show what happened the last time we had a sharp market selloff and a subsequent bounce that lasted three years. The graphic below shows the percentage change in the SPX as well as the absolute VIX level in the three years following the October 2002 lows in the SPX as well as the three years following the March 2009 lows. Note that from 2002-2005, the SPX rallied about 53%; the current rally in the SPX from the March 2009 close is over 100%.

Turning to the VIX, it starts the sequence in the 42s in 2002 and in the 49s in 2009. Note that in both instances, the VIX had made it into the teens within one year of the beginning of the bull move. As the 2002 bull bounce continued, however, the VIX plummeted, spending a great deal of time in the 10-13 range, with a median value of 15.30 in the first three years of that bull market. The rally off of the 2009 bottom has been a different animal altogether, however, with forays down to the 15s being extremely rare (though it did happen on occasion in 2010 and 2011) and a median VIX of 22.84 during that same initial three years of the bull market.

Of course not all bull markets are the same (and there are many that will not concede that the current rally is a bone fide bull market) and every wall of worry is made of different types of stones, but at some point investors need to come to terms with the reality of a VIX of 15, particularly when we are looking at realized volatility that has been sub-10 for the last two months.

Related posts:

Disclosure(s): none

[sources: CBOE, Yahoo]

Sunday, March 11, 2012

Economic Data vs. Expectations: Stocks and Employment Data Rallying Since October

Five weeks ago, in Economic Data: Divergence or Confirmation for Stocks? I looked at some of the disappointing January economic numbers and wondered if these were outliers that the market should ignore or an indication that the economy was losing some strength.

In that February analysis I noted:

“For this update, I have annotated the chart to show where manufacturing and employment have been the economic underpinnings of a rise in stocks. This time around the employment data seem to be moving in the right direction, but manufacturing has had trouble living up to expectations – at least for the past two months.”

With the benefit of some additional hindsight, it appears that the employment situation is even stronger than originally anticipated. In fact, looking back to the bottoming in stocks in early October, the improving employment situation which dates from that same period has coincided almost perfectly with an improving stock market. On the other hand, manufacturing and broader economic activity data have missed expectations more than they have exceeded them since the beginning of December – a trend stocks have continued to ignore.

The graphic below evaluates economic data relative to expectations across five groups of economic activity (manufacturing/general, housing/construction, employment, consumer and prices/inflation) and plots the relative level of positive and negative surprises in each category against the performance of S&P 500 index going back to the beginning of 2010.

One year ago the employment gains relative to expectations were just about peaking, while manufacturing would continue to post positive surprises for another two months or so. As expectations for the employment market ratchet upward in 2012, is it possible for the data to continue to deliver more bullish surprises?

[Readers who are interested in more information on the component data included in this graphic and the methodology used are encouraged to check out the links below. For those seeking more details on the specific economic data releases which are part of my aggregate data calculations, check out Chart of the Week: The Year in Economic Data (2010).]

Related posts:

Disclosure(s): none

[sources: various]

Thursday, March 8, 2012

IMOS Breaking Out, But Implied Volatility Fails to React

While I generally trade more ETPs than single stocks, I am always keeping an eye on what is moving in the stock world, particularly in terms of new highs, as it helps inform some of my thinking in terms of bottoms up sector analysis. One of the stocks that recently hit my new high radar is ChipMOS Technologies (Bermuda) LTD (IMOS), a provider of total semiconductor testing and packaging solutions to fabless companies, integrated device manufacturers and foundries.

What I find particularly interesting about IMOS is that in spite of the fact that it has made new 52-week highs four times in the past two weeks on a huge spike in volume (gray area in upper chart) and historical volatility (blue HV20 line) has jumped along with price, implied volatility (red IV 30 line) appears to be completely indifferent to the big price move.

Now IMOS options are thinly traded, but still, this stock is clearly breaking out and finding some action from momentum traders. Frankly, I am not sure why IV has not responded. Perhaps options traders are certain that this breakout will fail and see no need to adjust their prices. A better bet, as far as I am concerned, is that HV is doing a better job of pricing future stock moves than IV right now, which makes IMOS options very cheap, even considering the reasonably wide bid-ask spreads. My guess is that the current HV 20 of 91 is a better estimate of future volatility than the current IV 30 of 62. Either way, this could be an interesting breakout to watch – and perhaps even throw some options at.

Related posts:

[source(s): LivevolPro.com]

Disclosure(s): long IMOS at time of writing; Livevol is an advertiser on VIX and More

Wednesday, March 7, 2012

Is TVIX Now Just a More Docile UVXY?

Today is the eleventh trading day since Credit Suisse (CS) announced a suspension of new creation units in the VelocityShares Daily 2x VIX Short-Term ETN (TVIX) after the close of the regular trading session on February 21.

In the interim, all manner of investors, pundits, industry players and members of the media have attempted to grapple with the implications of this move for TVIX, for the broader class of VIX exchange-traded products (ETPs) and even for the VIX futures market as a whole.

One of the more thought-provoking perspectives on TVIX and the VIX futures market came from Dave Nadig and Gene Koyfman of Index Universe in Volatility ETFs Own All VIX Futures, which I consider to be required reading. The potential implications of the VIX ETP tail wagging the VIX futures dog were nicely summarized by Izabella Kaminska of the Financial Times, wh0 wondered, Time for Position Limits on VIX Futures?

While I find the regulatory, exchange and internal risk management issues that have been raised by the TVIX creation units halt to be interesting fodder for contemplation, I am much more interested in understanding how the market disruptions have changed the manner in which some securities move and the trading implications of these changes.

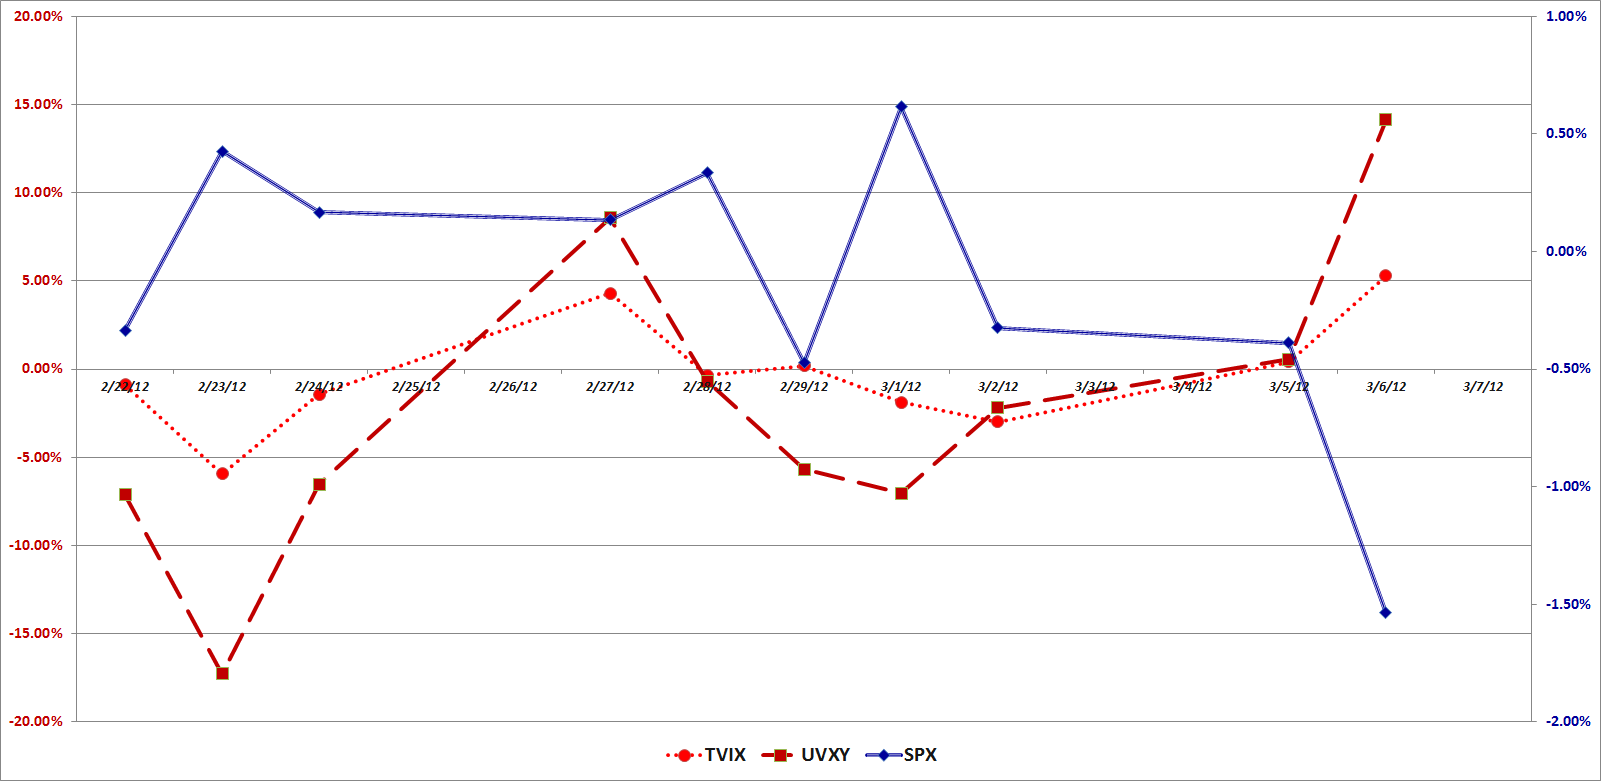
In the graphic below, I have plotted the daily moves for TVIX, UVXY and the S&P 500 index over the course of the last ten trading days. In short, while it initially appeared as if TVIX was holding up much better than UVXY as the market declined, now it appears as if TVIX is also much more sluggish to the upside as well. While TVIX has outperformed UVXY during the last ten days, the most compelling explanation for disconnect between TVIX and UVXY is that the new market environment has substantially lowered TVIX’s beta. In other words, TVIX now lives more in the realm of (+1x) VXX than (+2x) UVXY – and much closer to VXX at that. During the last ten trading days, UVXY has a 10-day historical volatility of 117, while VXX has a 10-day historical volatility of 60. And TVIX? Well, during this period TVIX has been even more docile than VXX, with historical volatility reading of only 45.

For now at least, TVIX appears much less prone to spiking than I would have expected. This does not, however, rule out the possibility of a TVIX short squeeze sometime in the future. Buyers – and sellers – beware.

Related posts:

[source(s): TD Ameritrade]

Disclosure(s): short TVIX, UVXY and VXX at time of writing

Tuesday, March 6, 2012

Putting the Current 2.6% SPX Pullback in Recent Historical Context

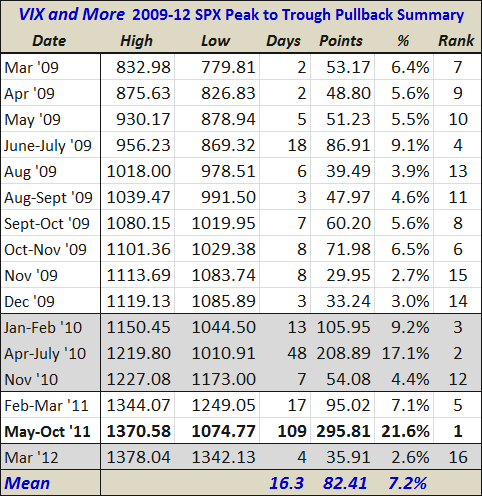
Since the beginning of the current bull market – which bottomed at 666.79 exactly three years ago today – I have periodically been posting a table of the most significant pullbacks in the S&P 500 index since that March 2009 bottom. For the record, the current 2.6% decline over four days is barely enough to get it to qualify as one of those 16 pullbacks.

The data below incorporates intraday readings and use pullbacks from high water marks to the eventual trough as the basis for calculating the magnitude and duration of the pullbacks.

While not captured in the table, investors should probably keep in mind that the median pullback during the last three years has lasted 7 trading days and dropped the SPX a total of 5.6%. Were we to see a median pullback form this time around, it would suggest a bottom of about SPX 1301 sometime on Friday after the employment report.

Those looking for bigger numbers might be interested to know that a mean pullback would put the SPX back to the 1275-1279 range, while a ‘pullback’ that would be comparable to the May-October decline from 2011 would set the SPX back all the way to about 1080.

Disclosure(s): none

VXEEM vs. VIX Indices and Futures in Today’s Selloff

Stocks have been eerily quiet for the first ten weeks of 2012, with only four 1% moves in the SPX so far – and all of those coming to the upside.

It just so happens that the CBOE’s launch of futures and options on the CBOE Emerging Markets ETF Volatility Index (VXEEM) coincided with this period of languid volatility, which has made it easier for this index to fly under the radar.

Today is the first time I am able to get data on the VXEEM futures in a market that is down at least 1% and I must admit to being somewhat surprised by the results.

The table below captures SPY and VIX data in the left column along with and EEM and VXEEM data in the right column. Note that approximately one hour into today’s regular trading session, SPY was down about 1.3% and EEM, the popular emerging markets ETF, was down 3.1%. So far, so good. Far more interesting, while EEM was down about 2.4 times as much as SPY, the VIX was up substantially more than the VXEEM index, 16.57% to 12.62%...so while the selloff was disproportionately in emerging markets, the panic was disproportionately in the S&P 500 index.

I also captured simultaneous futures data for March, April and May for both the VIX futures and VXEEM futures. Interestingly enough, the changes in the front three month futures for both the VIX and VXEEM were almost identical.

So what kind of volatility environment do we live in where the emerging markets index falls faster than the SPX (even beta-adjusted, but that discussion is for another day), while the VIX spikes much more than VXEEM, yet the futures for both products seem to move in almost identical fashion?

If you think you have the answer, pairs trading opportunities with VIX products and the VXEEM futures and options (there are no ETPs yet that are based on VXEEM) are certainly there for the taking. While VXEEM futures and options are not particularly liquid or deep yet, they are sufficiently liquid and deep from which to extract some profits.

Related posts:

[source(s): Interactive Brokers]

Disclosure(s): long EEM at time of writing; the CBOE is an advertiser on VIX and More

Sunday, March 4, 2012

Volatility Indices vs. Futures

The CBOE Volatility Index, also known as the VIX, is the most famous and widely quoted of all the volatility indices. It measures the market’s expectations of the volatility in the S&P 500 index (SPX) for the next 30 calendar days. Unbeknownst to many (despite my efforts), the VIX also has a lesser known sibling that measures the volatility expectations in the SPX for the next 93 calendar days: VXV.

In addition to the volatility indices, there are also markets for VIX futures; lately these have extended out eight or nine months into the future. Whereas the VIX and VXV evaluate volatility over the full course of a future window, the VIX futures are the market’s best guess at what the VIX will be at various snapshots into the future.  [The distinction is not that dissimilar to the snapshot of a balance sheet vs. the flows in an income statement or a cash flow statement in accounting.]  For this reason, it is certainly possible that an index which measures volatility over the next 93 calendar days may come up with a different value than a VIX futures product in which market participants attempt to estimate what the VIX will be at a specific point in time some 93 days later.

For the most part, the relationship between the VIX and VXV (which are calculations based on the implied volatility of a strip of SPX options) and the VIX futures (whose values are based on market prices) holds together fairly well.

Lately, however, the volatility index values have been much cheaper than the futures values for comparable time periods. In the graphic below, the VIX futures term structure (or at least the first eight months of it) is represented by the blue line, while the VIX and VXV are the red dots and dotted connecting line resting substantially below the VIX futures values.

Savvy traders may be able to find ways to take advantage of this and some related price discrepancies. Everyone, however, is free to ponder the source of the disconnect between SPX options traders and VIX futures traders.

Related posts:

[source(s): CBOE Futures Exchange (CFE), CBOE]

Disclosure(s): the CBOE is an advertiser on VIX and More

Saturday, March 3, 2012

Recent Research Projects and Expiring Monthly

It occurred to me than in a recent post, Five Years of VIX and More, I neglected to mention my contributions to Expiring Monthly: The Option Traders Journal, where I tend to publish some of my proprietary research and analysis in a somewhat longer form (1000-4000 words) than I do in this space.

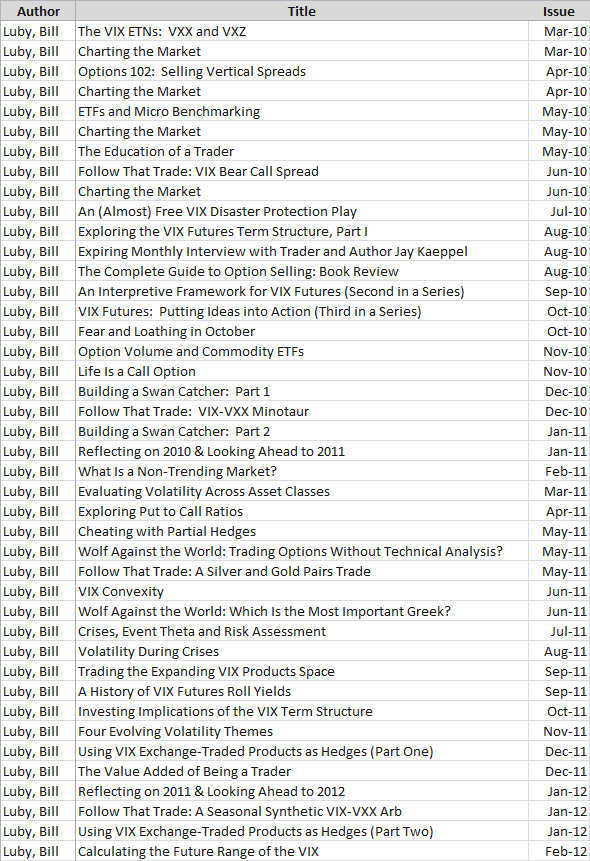
Rather than my typical screen shot of the table of contents and some brief comments on what I have been thinking about and writing for the magazine as of late, I thought that as the second year of Expiring Monthly has just concluded, it might be interesting to list all the titles of the 42 articles I have written for the magazine to give readers a sense of some of my more detailed research interests.

Accordingly, the graphic below lists all the articles I have written for Expiring Monthly in chronological order, up to and including Calculating the Future Range of the VIX, which was part of the February 2012 issue that was published last week.

I recently republished The VIX-VXX Minotaur Trade, which first appeared in the December 2010 edition of Expiring Monthly, in this space. The Education of a Trader, which also originated at Expiring Monthly in our editorial Back Page column, was republished here as well. Going forward, I think I will start pulling additional articles from the Expiring Monthly archives (perhaps 1-2 articles per year that are at least one year past publication) and see if they can find a wider audience here. Given all the recent interest in hedging, something like Cheating with Partial Hedges is certainly a candidate for finding its way onto these pages.

More information on prior issues can be found by following all the posts tagged herein with the Expiring Monthly label.  For those who are interested in subscription information and additional details about the magazine, you can find all that and more at http://www.expiringmonthly.com/.

Related posts:

Disclosure(s): short VXX at time of writing; I am one of the founders and owners of Expiring Monthly

Friday, March 2, 2012

Dynamic VIX ETPs as Long-Term Hedges

With the huge contango in the VIX futures term structure at the moment, anyone who is buying VIX options or the VIX exchange-traded products (ETPs) right now is having to pay for that contango in order to have the opportunity to capitalize on increasing volatility. With the contango-based negative roll yield currently running at 15% per month, this means the cost of a volatility hedge for long equity positions is extremely expensive in the current market.

Fortunately, investors do have some alternatives that have a different type of appeal.

There are two VIX ETPs, VQT and XVZ, which attempt to minimize the impact of the negative roll yield by using a market timing mechanism that dynamically adjusts the long volatility exposure. In more volatile markets, the exposure increases; in less volatile markets, the long volatility exposure is either very low (in the case of VQT) or can even flip to a small net short position (in the case of XVZ).

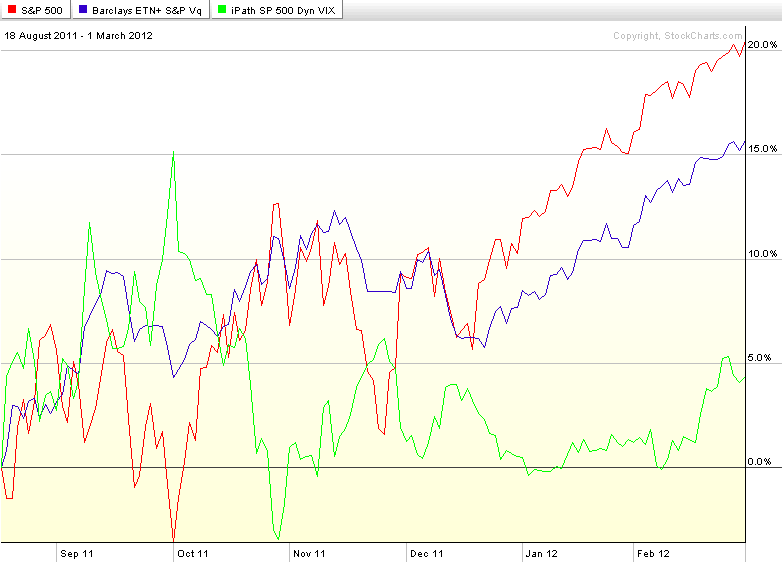
VQT is more of a portfolio replacement strategy, while XVZ is more of a portfolio augmentation strategy. Specifically, VQT has long SPY exposure that ranges from 60% to 97.5% of its portfolio, with the balance (2.5% - 40%) allocated to a long position in the VIX short-term futures (think VXX). The links below will provide more details.

XVZ, on the other hand, does not hold any long equity component, only short-term (again, think VXX) and mid-term (think VXZ) VIX futures. The twist here is that while the mid-term VIX futures component can range from 50-100% of the portfolio, the short-term component can be as high as 50%, but as low as negative 30%. So…under certain circumstances (e.g., a very steep VIX futures term structure, like the one we are currently experiencing), the portfolio will consist of the equivalent of a 30% short position in VXX and a 70% long position in VXZ. On balance, that type of portfolio should be very close to volatility neutral and in some cases even have a slight short volatility bias.

Since XVZ was only launched on August 18, 2011 (VQT dates back to September 2010), I have chosen a graphic that shows the relative performance of the SPX (red line), VQT (blue line) and XVZ (green line) from the launch of XVZ to the present. Note that with its long exposure, VQT is better able to take advantage of a low volatility slow bull market. XVZ, on the other hand, is generally close to flat in a low volatility bull market, but should the VIX spike sharply higher, XVZ will likely do a better job of capitalizing on the volatility spike.

As investors ponder the fatigued bulls and inevitable pullback sometime in the near future, certainly VQT and XVZ warrant a more detailed investigation, along with some of the non-volatility ETPs that are meant to reduce risk and hedge against a downturn, such as VSPY, SPLV, and others.

Related posts:

[source(s): StockCharts.com]

Disclosure(s): long XVZ and short VXX at time of writing

DISCLAIMER: "VIX®" is a trademark of Chicago Board Options Exchange, Incorporated. Chicago Board Options Exchange, Incorporated is not affiliated with this website or this website's owner's or operators. CBOE assumes no responsibility for the accuracy or completeness or any other aspect of any content posted on this website by its operator or any third party. All content on this site is provided for informational and entertainment purposes only and is not intended as advice to buy or sell any securities. Stocks are difficult to trade; options are even harder. When it comes to VIX derivatives, don't fall into the trap of thinking that just because you can ride a horse, you can ride an alligator. Please do your own homework and accept full responsibility for any investment decisions you make. No content on this site can be used for commercial purposes without the prior written permission of the author. Copyright © 2007-2023 Bill Luby. All rights reserved.
 
Web Analytics