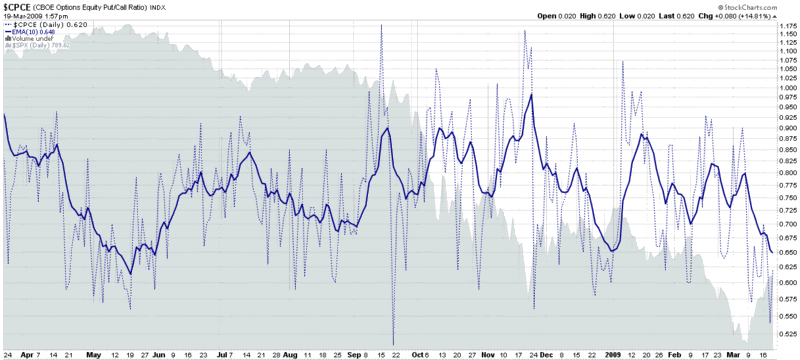
Equity Put to Call Ratio Hits Ten Month Low
At the moment it is not at all difficult to find an indicator that believes stocks are overbought, at least on a short-term basis.
Of the many out there, I choose to highlight the CBOE’s equity ratio (CPCE), which, along with the ISEE, is one of my two favorite put to call ratios.
In the chart below, there is ample evidence of low levels of put activity compared to call activity at the CBOE. The daily data are represented by the dotted blue lines; I also use a 10 day exponential moving average to smooth the data over a two week period. I find that the 10 day EMA gives excellent contrarian signals. The most recent low in the 10 day EMA was at the beginning of the year and was a slightly early sell signal. The last time the 10 day EMA was this low was in May 2008, when it was an even more timely sell signal.
Longs, this looks like a good time to take some profits. Shorts, expiration week can sometimes delay trend reversals by a few days, but by Monday, the trend is likely to be back down.
[Edit: A commenter asked for an explanation of how to read this chart. For those who are interested, my response is in the comments section below.]

[source: StockCharts]


8 comments:
The VIX and VXV spikes today seem to enhance your conclusion about next week, agree?
Agreed, anon. FWIW, I think the VXV is particularly telling.
Bill,
Can you explain in simply terms the different gauges (lines, graphs in the background)on how to read the chart. Thank you.
I'd be glad to, anon.
The chart comes from StockCharts.com and is created with a very basic portion of their large tool set.
The chart covers one year.
First, the easy part. The background gray/green area chart is of the SPX. There is no axis for the SPX, but you get a sense of the relative movements of the index from the flow of the gray/green mass.
The dotted blue line represents the closing daily values for the CBOE equity put to call ratio (a.a.a. the CPCE, a simple ratio of put volume divided by call volume.) The axis for these values is on the far right.
In truth, the end of day values for the CPCE are totally independent of the each other, so there is no mathematical reason to connect values across multiple days other than to show a trend. As you can see, single day values tend to be "noisy" so I have added a second line that is easier to read and interpret: the solid blue line is a 10 day exponentially smoothed moving average (gives greater weight to more recent values than a standard moving average) of the dotted blue line.
The chart is best read by looking at extreme values in the solid line (CPCE 10 day EMA). I generally like to pick a number that corresponds with the highest and lowest 3-4 spikes per year and check to see if those reflected turning points in the SPX. In the time frame covered by the chart, I would probably look at 0.68 and 0.88 (or...better yet, go back another year or two to get a better historical data set).
Since put to call ratios are contrarian indicators, lower readings (e.g., EMA <= 0.68) should identify markets tops and/or long entry points. By the same token, higher spikes (e.g., EMA >= 0.88) should flag market bottoms and/or short entry points.
For reference, here is an older chart with the upper (bearish = red) and lower (bullish = green) extremes superimposed on the chart in horizontal lines: CPCE Equity Put to Call Ratio No Longer Bullish [Note that in the earlier version of this chart in the link above, the SPX is the black line, the daily CPCE is the gray area chart and the 10 day EMA is the dotted blue line.]
I hope this helps.
-Bill
Bill
Thanks for this. I too look at the put / call ratio. The ratio seems very low and even disproportionately low compared with implied volatility readings.
I had a brief look to see if anyone in the blogsphere was talking about this and noticed a comment from someone who distrusted the numbers given how low they are. In fact, even before this bounce the PC Ratio was quite low.
His idea was that perhaps there was now a one-off situation where a lot of people had calls on penny stock (or should I say low priced) banking shares on the grounds that given how low they were this was an inexpensive bit of speculation. I have no idea whether that reasoning makes sense or not. But it made me wonder whether the low PC Ratio now is broadly based on whether it is concentrated in certain sectors. Do you know the answer to that?
Important point you made here. Thanks for the tip off to the shorts (that's me) re: delayed reactions.
Douglas
Bill,
Thank you for your time to explain.
The Vix closed below forty in four trading days since the beginning of October 2008. Thus, the probability of the Vix increasing above Wednesday's close of just below forty-one when several short-term stock market technical indicators were overbought was good. The Vix traded to a high of 47.63 earlier today, an increase of over sixteen percent from Wednesday's close. The ten month low in the equity put to call ratio was one of several technical indicators that projected higher levels for the Vix index.
thanks !
Post a Comment