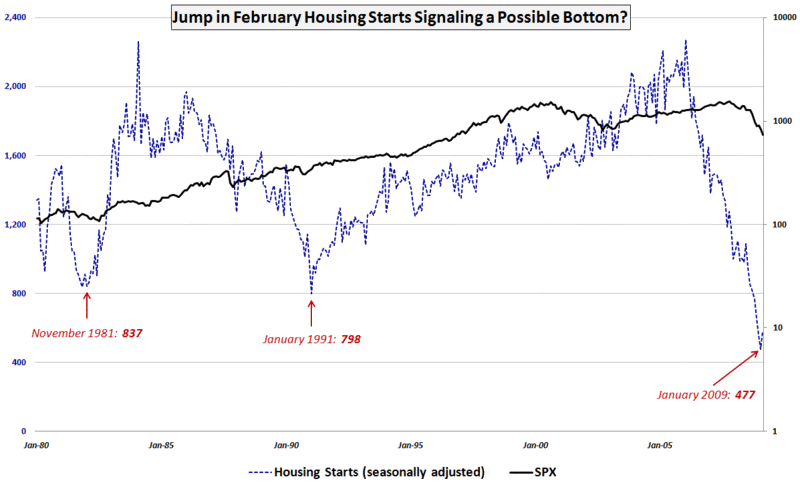
Chart of the Week: Bottom in Housing Starts?
Conventional wisdom dictates that it is way too early to even contemplate a bottom in housing, where prices presumably have another 10-20% to fall. In light of the February housing starts data released on Tuesday, I am wondering if we might be closer to a bottom in housing than many of the pundits believe.
This week’s chart of the week tracks housing starts going back to the beginning of 1980 and shows the January 2009 number as an all-time low. The February data, which is subject to future revisions, shows a 22.2% increase from the January low in combined single-family (+1.1%) and multi-family (+82.3%) housing starts.
The February data could certainly be just a statistical anomaly, but the next data point that suggests a possible stabilizing of housing prices, increase in demand or significant decrease in inventories could cause a rapid reevaluation of where the housing market stands and where it may be going in 2009.
I am not yet a housing bull, but I will be watching tomorrow’s February existing home sales and Wednesday’s February new home sales very closely to see what the numbers tell us.
[source: Census Bureau, VIX and More]


1 comments:
tHE POINT THAT EVERYONE IS MISSING IS THAT THERE HAS BEEN VERY LITTLE FORCLOSURES BY FANNY, FREDDIE AND THE LARGE BANKS SINCE NOVEMBER DUE TO THE MORATORIUMS. tHERE WILL BE A LARGE PENT UP INVENTORY RELEASED SOON. JUST LIKE A DAM BREAKING
Post a Comment