XLF Bias Depends on Time Frame
Lately it seems as if the financial sector is the market. For this reason, I now watch the financial sector SPDR (XLF) and the KBW Bank Index (BKX) tick by tick, in addition to a handful of financial stocks that seem to be in the most peril on a particular day.
In my opinion, however, XLF is the best way to capture the full extent of goings on in the financial sector, from banks and brokerage houses to insurers and consumer finance companies, XLF pretty much covers the waterfront.
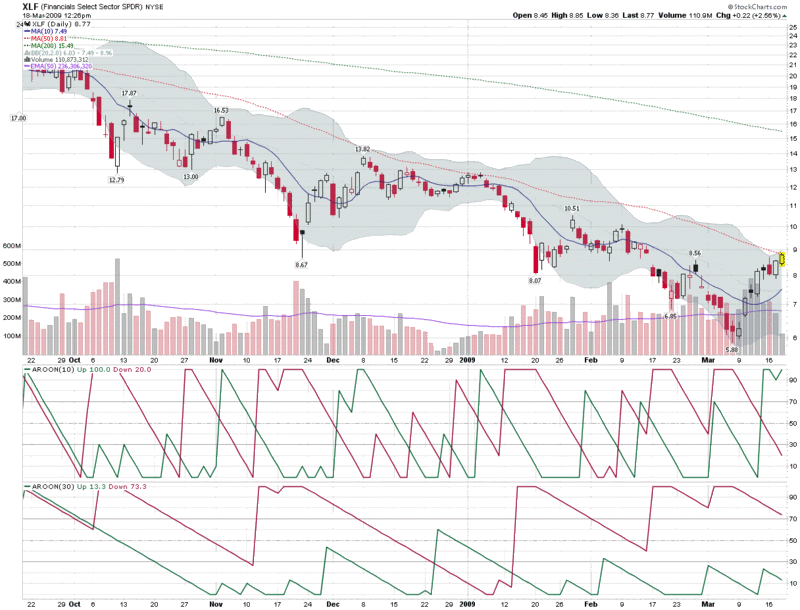
The chart below captures the last six months of action in XLF and highlights the problem facing XLF and the broader markets at the moment. Stocks are overbought in the short-term and oversold in the long-term.
Rather than use oscillators to show how overbought and oversold stocks are, I generally prefer to rely on a combination of moving averages and trend strength indicators, with volatility as an important secondary indicator. Looking at the moving averages, XLF is now well above the 10 day MA and running up against resistance in the form of the 50 day MA. In terms of trend, utilizing the Aroon indicator to measure trend and breakout strength, XLF is bullish in the 10 day calculations, but bearish from a 30 day perspective. In this chart there is not much to see in terms of volatility, but by tracking in the upper half of the Bollinger Bands, XLF generally has positive short-term momentum, while proximity to the upper band suggests a reversal is likely soon.
So there you have it: bullish momentum triggering buying on the part of the trend following crowd, while overbought indicators have the swing trading crowd ready to get short. Such is the current state of the market. The direction in which you lean is more likely to be a function of the time horizon of your analysis than any other technical factor.

[source: StockCharts]
Disclosure: Short XLF at time of writing.


8 comments:
Hi, I keep telling me myself to look into that aroon indicator... and I never do. Yikes, how many indicators are there? But I'm with you regarding the XLF. You are right, XLF is the market right now. The relative strength chart is probably even more important. I was a little surprised at first the commodities didn't react to the weak US Dollar, but then I thought the smart money is moving into the rate sensitive sectors now. And the industrials, materials, and energy are going to pop down the road. Bernanke and Obama are starting to look like they have gained control of this situation.
Good points Bill on the timeframe and the differences between the views of different traders.
By the way, something I was meaning to ask. On 13 March there was an increase in the VIX despite the market going up. The increase in the VXO that day was even greater, about a 5% jump despite the market going up. Do you know why that was?
Hi HC. XLF is up once again in the pre-market today. It's options expiration, so anything can happen, but I think this is a little much, given current fundamentals in consumer credit and commercial real estate.
I'm thinking its also time for a post on Aroon, but maybe I'm better off if nobody else is following it...
Douglas,
Regarding March 13, that was indeed a strange day in that it was a Friday. On average the VIX goes the 'wrong way' once per week, but rarely on a Friday. I'm still not sure what to make of it, even with a little hindsight. Sometimes it's just some transactional outliers.
...or perhaps the VIX just doesn't want to go below 40.
Cheers,
-Bill
Bill
Thanks. That makes me want to investigate this a bit more. A while ago I looked at instances of IVolatility going up as the market goes up after a period of the declining IV relative to the mkt and concluded that it's actually bearish -I think you looked at the same thing.
Today I'm away from my desk but checked the mkt & the VIX & I'm astonished. What's going on? Does somebody know something? They are out of proportion...
Any insights or have I misread or missed something obvious?
Douglas.
Bill
When I made my comment above, while away with only iphone for a bit of data, and I referred to a previous study of yours I think I was mixing up the study you did with the VIX and the market moving in the same direction rather than what today's situation was which is a big bounce in IV compared with a smallish market decline.
Douglas
any particular reason why you prefer the xlf? i follow the iyf when trading the skf.
Douglas,
Strange things can happen during options expiration week, but there may also be more of a sense that some of the good news just happened to line up at the right time, while the dominant news flow is still decidedly negative.
SS,
As an indicator, I'd probably call XLF and IYF a wash, but one of the main reasons I like XLF is because I trade their options a lot -- and XLF options have massive volume and are more liquid than most stocks. For example, the March 7 calls alone had a volume of 860,689 today.
Cheers,
-Bill
I just saw your blog for the first time today. I was stunned but also pleased to see that you use almost the same indicators I do. Great minds think alike?!
I have my own blog, but because I use it as a personal journal of my trading, including financial data, I chose to take it private. Only I have access now.
I enjoy your blog. Can I use you as a confirming indicator? :)
Post a Comment