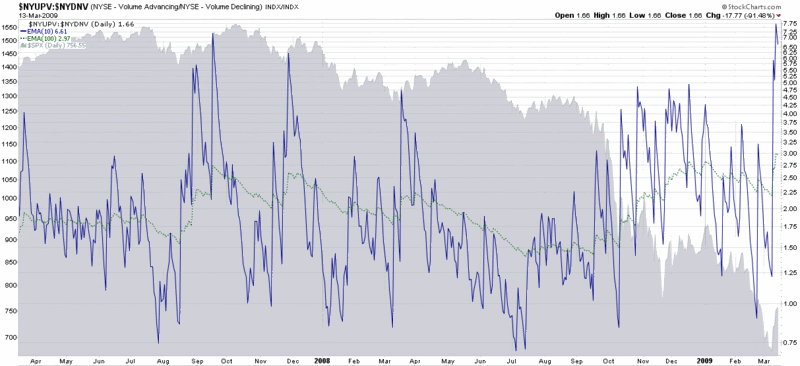
Chart of the Week: Extreme Readings for Up Volume vs. Down Volume
I did the best I could to avoid yet another chart about banks or the financial sector this week’s but even indirectly, it is hard to come up with a chart that isn’t about the banks. So be it.
This week the chart of the week is a ratio chart of the volume of advancing issues to declining issues for the New York Stock Exchange. There is a considerable amount of noise in the short-term for this data, so I have used a ten day and 100 day exponential moving average to smooth the data, but retain the important trends. The story in this chart is the massive surge in up volume to down volume during the past four days that has pushed the ratio to levels seen only once before, in 1997, for my 18 years of data. In the past, extreme up volume relative to down volume has usually been a precursor to a bullish move of one to eight months, but in the current market environment, there is no guarantee that historical patterns will hold.
Of course, if the banks continue to move up on large volume, it will be difficult for the broader markets not to follow…

[source: StockCharts]


1 comments:
all the sellers are too busy covering their short positions.
If you look at the volume over the last few trading days, it starts to taper off.
my guess is this was exhaustion of a counter trend rally, nothing more...
Post a Comment