Showing posts with label ISEE. Show all posts

Thursday, June 13, 2013

ISEE Equities Only Index Prints Something Not Seen Since March 6, 2009

Put to call ratios are a permanent fixture in my indicator stable and something I have been writing about for a number of years, including an early 2007 effort, A Sentiment Primer (Long).

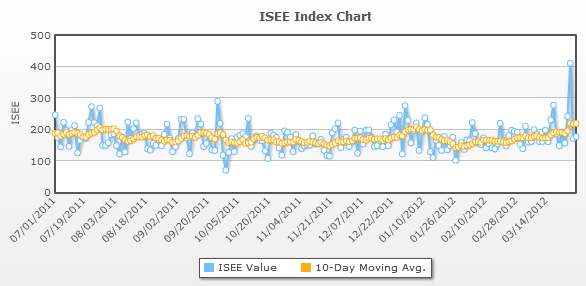
My perennial favorite of all the off-the-shelf put to call ratios actually inverts the traditional ratio: the ISEE equities only call to put ratio. This ratio only counts opening options purchases and excludes index and ETF products so as to provide a more targeted approach to divining what sort of speculative trades retail investors are favoring.

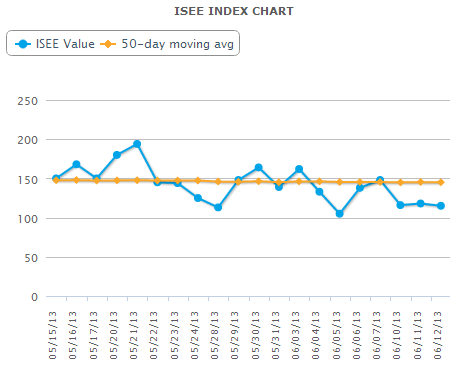
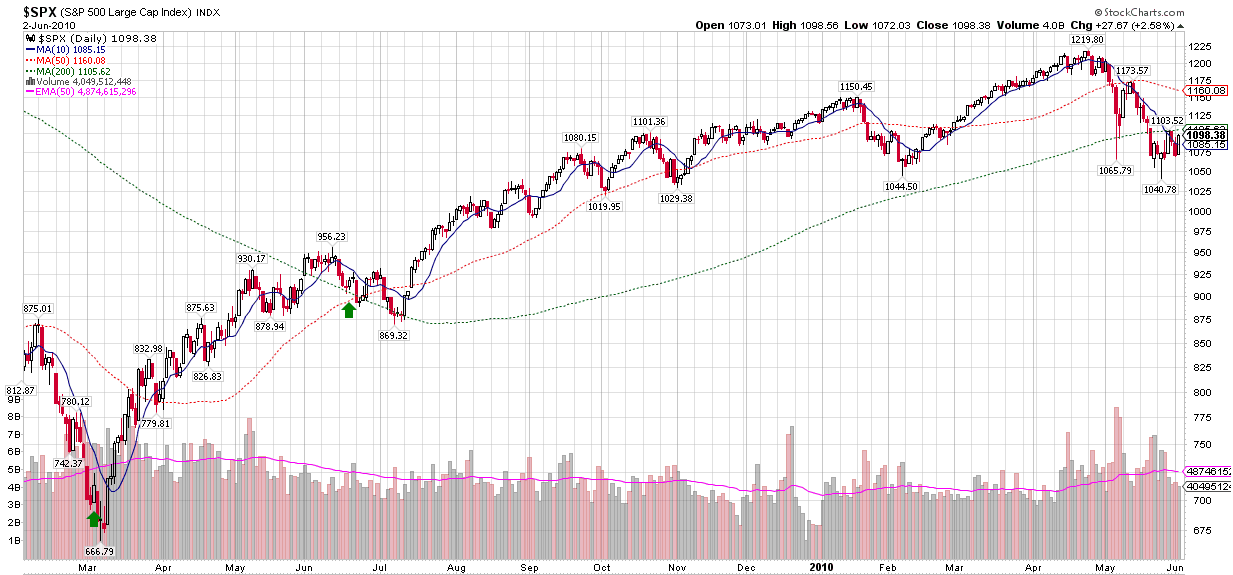
What got my attention yesterday was that in reviewing the components of my proprietary Aggregate Market Sentiment Indicator (AMSI) for the newsletter, I saw that the ISEE equities only call to put ratio closed under 120 (meaning less than 120 opening call purchases per 100 opening put purchases) for three consecutive days for the first time since March 6, 2009 – the date when the SPX put in its post-crisis bottom at 666 and began what has now been a bull leg that has lasted more than four years.  Not surprisingly, this kind of hat trick is typically associated with conditions in which stocks are extremely oversold and ripe for a bounce, as appears to be the case today and was certainly the case in March 2009.

For the record, the ISEE equities only call to put ratio is back in the middle of its traditional range today, most recently at 178, as the financial markets are discovering some sort of normalcy – at least outside of the context of the Japanese yen.

The chart below shows the ISEE equities only call to put ratio, using closing values for the past month, as of yesterday’s close.

Note that the ISEE ratios come in two other flavors: an index that is limited to index and ETF transactions; and an all securities index which combines the equities only data and the index + ETF data. Current and historical data for all three versions of the ISEE call to put ratios, as well as an interactive chart, are available at the ISEE Index page.

For those who may be interested in learning more about put to call ratios, I have a larger than usual list of links below to jump start your research.

[source(s): International Securities Exchange]

Related posts:

Disclosure(s): none

Thursday, May 17, 2012

A Million SPX Put Contracts Traded Today…a Contrarian Timing Signal

With a half hour to go in today’s trading session, over one million put contracts have already been traded on the S&P 500 index, which is about 2 ½ times the average daily volume. This elevated put volume comes on top of 913,000 SPX put contracts yesterday, which was the second highest for 2012.

The one million level is rarely seen in SPX puts and generally indicates an extreme amount of hedging on the part of institutional investors, as well as increased speculative activity.

Looking at the chart below, which goes back two years, one can see that in those rare instances when put volume (vertical red bars on lower half of chart) reached one million, this typically coincided with a bottom in stocks.  [Edit:  today’s finally tally is 1.28 million SPX puts, the highest total since August 9, 2011]

In addition to puts in the SPX, I also closely follow the ISEE equities only call to put ratio. The indicator I have developed which is based on the ISEE is now showing is greatest contrarian bullish bias (due to a preponderance of put volume) since the end of June 2010, just two days before the SPX put in an key bottom at 1010.

Of course, history is not guaranteed to repeat itself or even rhyme in the face of the current worries about Greece and Spain, but the odds now favor stocks finding at least a short-term bottom very soon.

Related posts:

[source(s): LivevolPro.com]

Disclosure(s): Livevol is an advertiser on VIX and More

Thursday, March 29, 2012

New Single Day High in ISEE Equities Only Index on Monday

Lost in all the hoopla over the VelocityShares Daily 2x VIX Short-Term ETN (TVIX) was a historic event in the options and market sentiment world on Monday: a new single day high in the ISEE equities only call to put ratio.

To recap for those who may not be familiar with the ISEE, this ratio was developed by the International Securities Exchange (ISE) and is calculated by dividing opening long call options bought by ISE customers by opening long put options bought by ISE customers, then multiplied by 100. The ‘equities only’ slice of the full transaction pie means that all trades with indices and ETPs are excluded from this data, which also reduces the likelihood that any of the ISEE equities only data includes trades intended largely as portfolio hedges.

Monday’s record close of 410 means the ISE customers were buying four times as many calls as puts. Because there tends to be a lot of noise in the daily data, I like to average the data over a 10-day period. The chart below shows the ISEE equities only index since July 2011, along with the 10-day moving average.

Generally, put to call data is considered to be a contrarian indicator that flags when the masses are becoming overly exuberant or fearful and on Monday at least, exuberance – rational or otherwise – was running rampant, perhaps over the excitement of growing evidence of possible QE3 activity and a Bernanke put in general.

For what it is worth, the prior single day high in the ISEE equities only index dates from December 2010, when stocks were in the middle of a six-month bull move that resembles the current move in several respects and carried the SPX from 1039 to 1344.

Related posts:

[source(s): International Securities Exchange]

Disclosure(s): short TVIX at time of writing

Thursday, June 3, 2010

Yesterday’s Unusually Low ISEE Equity Number

Yesterday’s ISEE equities only closing value of 100 was sufficiently low that only once in the last year has there been a lower number.

Recall that the ISEE is a call to put ratio (or an inverted version of the more common put to call ratio) and that the equities only variant is probably the best way to tap into the options habits of the retail options trader.

The chart below goes back to February 2009 to highlight with a green arrow the only two instances where the ISEE equities only index closed below 100. Note that both instance occurred just prior to an important bottom.

In the current context, the fact that the low ISEE equities only number appears just after what I think may be an important bottom raises two distinct possibilities:

  1. SPX 1040 may not turn out to be a bottom…OR

  2. SPX 1040 has a very good chance of holding as many investors are still firmly in the bear camp and have yet to come around to the long side

For more on the rationale behind the second alternative, which is the direction I am leaning in at the moment, Checking for Athiests (and some of the other posts linked below) may be of interest.

For more on related subjects, readers are encouraged to check out:


[source: StockCharts.com]

Disclosure(s): none

Monday, March 1, 2010

Chart of the Week: Total Put to Call Ratio

Thanks to all who submitted charts for the chart of the week contest. After getting off to a slow start, I was somewhat skeptical that my idea of opening up the chart of the week to readers would turn out as I had hoped, but when over two dozen submissions landed in my inbox, I was humbled by the breadth and depth of the body of work they represented.

Alas there can only be one gold medal and this time around (I’m sure I will do this again), the winner is Amir from Las Vegas.

Amir’s chart shows how using the CBOE’s total put to call ratio (CPC) could have been helpful in identifying tops and bottoms in the S&P 500 index during the course of the last year. The areas highlighted in yellow show that the total put to call ratio (which summarizes put and call activity for individual equities plus indices) spiking to extreme levels during the June-July 2009 low and just last month dropping to the lowest level in several years. Clearly last month's signal was an excellent time to trade on the short side, at least for the short-term. Whether the extreme reading turns out to be a harbinger of a much steeper downturn remains to be seen.

My personal bias is to use the ISEE and CPCE (equity only) put to call data, but any one of these indicators is capable of generating excellent short-term to long-term market timing signals.

For his efforts, Amir also wins a one year free subscription to Expiring Monthly: The Option Traders Journal.

Thanks again to all those who submitted a very strong group of charts. As much fun as this was, I will be sure to periodically open up the Chart of the Week competition to readers going forward.

For more on related subjects, readers are encouraged to check out:


[source: StockCharts]

Disclosure(s): I am one of the founders and owners of Expiring Monthly


Thursday, March 19, 2009

Equity Put to Call Ratio Hits Ten Month Low

At the moment it is not at all difficult to find an indicator that believes stocks are overbought, at least on a short-term basis.

Of the many out there, I choose to highlight the CBOE’s equity ratio (CPCE), which, along with the ISEE, is one of my two favorite put to call ratios.

In the chart below, there is ample evidence of low levels of put activity compared to call activity at the CBOE. The daily data are represented by the dotted blue lines; I also use a 10 day exponential moving average to smooth the data over a two week period. I find that the 10 day EMA gives excellent contrarian signals. The most recent low in the 10 day EMA was at the beginning of the year and was a slightly early sell signal. The last time the 10 day EMA was this low was in May 2008, when it was an even more timely sell signal.

Longs, this looks like a good time to take some profits. Shorts, expiration week can sometimes delay trend reversals by a few days, but by Monday, the trend is likely to be back down.

[Edit: A commenter asked for an explanation of how to read this chart. For those who are interested, my response is in the comments section below.]

[source: StockCharts]

Monday, December 29, 2008

ISEE Equity Call to Put Ratio and the End of the Year

Further to this morning's ISEE Put to Call Ratio at Highest Level in 16 Weeks, the ISEE equities only call to put ratio finishes at 198 -- the highest close since May 16, 2008.

The last time this index had back to back closes this high was 12/28 and 12/31/07.

It is worth noting that the only other year for which the ISEE equity only data is broken out is 2006; that year also had some higher than normal readings on the last four trading days of the year.

Given the brief holiday track record of the ISEE, my suggestion is not to dismiss the ISEE equity only data out of hand, but to take it with a grain of salt.

ISEE Equity Call to Put Ratio at Highest Level in 16 Weeks

The ISEE equity call to put ratio hit a 16 week high of 189 on Friday, as investors showed a strong preference for calls over puts. Today that ratio is even higher, at 215 as of 11:30 a.m. ET.

Trading is light so far and extreme values in the ISEE have a tendency to revert to the mean (146) as the day wears on, but coming on the heels of Friday’s high number, I believe the ISEE numbers should bear watching throughout the day.

For the record, the last time the ISEE equity call to put ratio was over 200 in a single session was back in the middle of May. At that time, the markets were just in the process of putting in a post-March top.

[source: International Securities Exchange]

Friday, November 21, 2008

International Securities Exchange Revamps Implied Volatility Charts

The International Securities Exchange (ISE), which publishes a superb implied volatility chart that I have featured on VIX and More on a number of occasions, has recently launched an enhanced version of their IV chart. The new version of this chart, which I have appended below, adds an “ISEE value” to the list of data. I have discussed the ISEE call to put ratio frequently in this space in the past. In this incarnation it is simply a ratio of call volume to put volume for the specified security.

I chose Citigroup (C) as my example security because all eyes should be on this bank, which is now trading at a 14 year low after hitting 3.57 earlier this morning. If Citigroup crumbles, it will dwarf the chaos created by AIG and Lehman Brothers.

Finally, for more information on the company that is the source of the volatility charts used by the ISE, check out Livevol.

[source: International Securities Exchange]

Friday, September 19, 2008

Puts Instead of Shorts?

The table below shows call and put activity at the International Securities Exchange (ISE) during the first two hours of today’s trading. Keep in mind that the ISEE is a “call to put” ratio, not the “put to call” ratio reported by the CBOE.

As reflected in the table, right out of the gate there was a flood of calls for indices, ETFs, and individual stocks. Note that in the last hour or so, the activity has tilted heavily toward the put end of the spectrum, as the call to put ratios have dropped dramatically. It is difficult to differentiate between hedging and speculation in these transactions, but now that options spreads seem to be tightening and implied volatility is dropping sharply, I suspect those looking to get short financials and any other part of the market may be leaning toward puts.

It will be interesting to see how the options market is affected by the new shorting regulations.

[source: International Securities Exchange]

Monday, March 3, 2008

Put to Call Data at Extreme Levels

Earlier this morning, I mentioned that the ISEE is setting new records on a daily for the all-time lowest readings in the 20, 50 and 100 simple moving averages and pointed out that the CBOE Equity Put to Call numbers have spiked to record levels as well. I thought a graphic might do a better job of telling the story, so I have attached a weekly chart of the CBOE Equity Put to Call Ratio below.

The chart goes back to the point at which the CBOE started publishing equity only put to call data and uses a 10 week EMA as a smoothing function. As the chart shows, the current EMA of 82 is a new record, eclipsing the old record of August 2004. In retrospect, 2004 was a great buying opportunity for those who had the fortitude to go against the crowd. As for the present, while the jury is still out, the odds are that the current situation is also a good buying opportunity, as difficult as it may be for some to pull the trigger.


[source: StockCharts]

Put to Calls and TRIN More Skittish than VIX, VWSI

A quick programming note: henceforth, I am going to be a little more freeform with my end of week commentary, making it less VIX and VWSI-centric. Lately the VIX has been at best a sub-plot in the market turmoil and the VWSI has not generated any extreme readings, so I will be expanding my weekly scope to include some of my other favorite indicators: put to call ratios, market breadth data, TRIN numbers, etc. going forward – or whatever else looks to be most newsworthy.

The Wall Street Journal “What’s Hot and Not” graphic shows where the action was last week – and this story is starting to look familiar. Oil, gold and other commodities were the biggest gainers last week, with a weak dollar and a weak US stock market accounting for the biggest losers.

The VIX ended the week up 2.48 (+10.3%) to 26.54, with the VWSI slipping back to zero. More interesting was the action in the put to call data, where the ISEE set all-time records lows for the 20, 50 and 100 day moving averages each day from Tuesday through Friday and the CPCE (CBOE Equity Put to Call Ratio) hit a new high of 1.50. In the wake of Friday’s precipitous drop, the TRIN and NASDAQ TRIN also ended the week with extreme readings of 2.46 and 2.76, respectively.

All this continues to mean one of two things: either the market is extremely oversold and anxious investors are going to create a massive wall of worry for a nice rebound…or we are in the midst of a financial meltdown not seen in the lifetime of most investors. I continue to reside in the former camp, but am watching SPX 1310 and NDX 1725 for signs of additional cracks in the dike.

Friday, February 29, 2008

McClellan Summation Index Turns Positive

It may seem like the height of folly to be talking about an upturn in the market on a day when the DJIA is down 230 points, but I’m not going to let that stop me.

Apart from the recent bump in the markets, I see several factors that lead me to believe that the markets are poised to continue to go up from current levels. The first of these, as highlighted by J.J. McGrath on his MackTheKnife blog, is that money formerly on the sidelines is starting to flow back into mutual funds. It may not be a flood yet, but it is a toe in the water. The second factor is the persistent extreme readings in put to call ratios that are evident in the ISEE and the CBOE equity only numbers. These numbers indicate that while some institutional money is coming back into the market, many retail investors are still sitting on the sidelines or have a short bias.

A third way to think about pent-up demand is to look at the McClellan Summation Index, a chart of which I have appended below. As can be seen in the chart, the index just turned positive for the first time since late October. While this is by no means a guarantee that the markets are moving up, this signal has historically been a bullish one. Perhaps more importantly, one way to think about the size of the red areas under the zero line is that these represent bearish periods in which pent-up demand continued to accumulate under the surface, roughly proportionate to the duration and magnitude of the red spike.

To summarize my thinking here, two bullish signals are mutual funds moving cash into the market and advance decline data turning positive, suggesting that the tide has turned. At this stage, only options sentiment data needs to normalize to indicate that the retail investor is once again comfortable going long and helping to push the market out of the recent trading range.


[source:  StockCharts.com]

Tuesday, February 19, 2008

More Sideways VIX and VWSI Action While ISEE Plummets

From a volatility perspective, 2008 continues to unfold in a curious manner. The markets are decidedly bearish – and even when they briefly recover or drift sideways, the doom and gloom headlines continue to cast a long shadow over investors’ expectations about the markets going forward. The VIX, on the other hand, hardly seems to care, registering an increase of 1.08 over the last seven weeks. The same is true for the VWSI, which has treaded water in the +3 to -3 range during this period.

Last week was more of the same. The VIX dropped 2.99 (10.7%) to 25.02. The VWSI moved more significantly, from 0 to +3, but the +3 reading from the end of the week is still consistent with a neutral outlook.

As is my weekly custom, for a survey of the best in current thinking about the markets, Barry Ritholtz at The Big Picture sums up the week that was and the week that is on tap in his 3-Day-Weekend Linkfest!

In the realm of interesting market sentiment data, I continue to be most interested in the ISEE, which ended the week with several record low readings. This is normally a bullish contrarian indicator, but as I have noted here on several occasions, the divergence with the volatility indices is a bearish signal.

(Note that in the above temperature gauge, the "bullish" and "bearish" labels apply to the VIX, not to the broader markets, which are usually negatively correlated with the VIX.)

Wine pairing: For previous VWSI readings of +3, I highlighted sauvignon blancs from Cloudy Bay and the Marlborough region of New Zealand, as well as some excellent California producers whose sauvignon blanc can be had locally for $10 or less: Bogle; Chateau St. Jean (where it goes under the fumé blanc moniker); Concannon; Kenwood; and Sterling. More recently, I was impressed by a complex sauvignon blanc, with a little bit of oak, from Gary Farrell Vineyards. Their 2005 effort can be had for about $25; for my money, it knocks the socks off almost all of the chardonnays in that price range.

Finally, for an entertaining (think the mannerisms of Joe Pesci and Woody Allen blended with the enthusiasm of Jim Cramer) and informative look at sauvignon blanc, I encourage the reader to sample Gary Vaynerchuk's "Sauvignon Blanc Taste-Off" on wine library tv.

Friday, February 15, 2008

More Record Lows in the ISEE

I haven't bothered posting about the ISEE lately not because nothing of interest is happening with that index, but because the story hasn't changed. In fact, the ISEE has set new record lows in the 20 day simple moving average for the past two days and the 50 day SMA for the past three days.

The VIX may look placid, but be careful not to conclude too much from that one data point. Options buyers may not be panic-buying puts and driving up volatility readings, but their relative interest in buying calls vs. puts is much lower than it ever has been during the six years for which the ISE has published ISEE sentiment data.

As I mentioned a month ago, history suggests that the markets usually struggle after we have a lackluster VIX combined with investors who are reluctant to buy calls.

Thursday, February 7, 2008

Sentiment Failures

I am of the opinion that failures usually provide more important signals than confirmations. For instance, if a company reports good news and sells off, then that action speaks louder than if the stock had bounced on the news (not withstanding all the “buy on the rumor, sell on the news” lore.) The same is true for broad market data and the broader indices. To my mind, these are fundamental failures.

There is an analogous situation with technical analysis. A failure in this context could be a stock or index that has consistently bounced off of a particular support level that now violates that support and continues lower. I believe that these TA failures speak volumes more in terms of informational content than if support had held for the n+1th time.

Which brings us to yesterday. Two measures in particular suggested that market sentiment was so strongly negative as to make a bounce a high probability event: the ISEE had just hit a new low in its 20 day SMA and the NASDAQ TRIN (30 day EMA) had spiked to levels not seen since 2002. The bottom line is that it a bounce should have been like shooting fish in a barrel for the bulls. Since the bulls could neither hold onto their gains, nor put a dent in the selloff that ensued, I am forced to conclude that in the course of this substantial sentiment failure, they didn’t even graze any of the fish. I am also changing my bias to bearish until the bulls can demonstrate a modicum of marksmanship…

Wednesday, February 6, 2008

Mean Reversion After Big Drops

Eddy Elfenbein at Crossing Wall Street has a nice little graphic and commentary up today: How the Market Behaves on Big Down Days.

After researching the 37 instances in which the S&P 500 index dropped 3.2% or more (as it did yesterday), Elfenbein draws the following conclusions:

“The average loss for the sell-off is 5.01%. After that, nearly every day is an up day. By the ninth day, the S&P 500 is down 3.48%, which is indeed, a retracement of about one-third. The market still trends higher to the 17th day where it's down just 3.01%, or about a 40% retracement. At that point, the linger effects of the sell-off seem to dissolve.”

Elfenbein’s findings should come as no surprise to those who pay attention to the TRIN and ISEE, as well as the VIX, various market breadth indicators, etc. While volatility has been on the tame side lately, the TRIN, ISEE, and McClellan Summation Index have all been suggesting a strong oversold situation and a high probability mean reversion bullish entry.

The duration of the retracement pattern identified by Elfenbein is also worth noting, as it hearkens back to some work on VIX spike retracements I published last April in Lessons from the Post-2/27 VIX Price Action, where the optimal retracement window was determined to be about eight days.

Tuesday, February 5, 2008

Massive Put Buying on ISEE Toward the Close

About 230,000 equities only puts (vs. about 22,000 calls) between 15:10 to 15:30

Monday, February 4, 2008

Divergence Between Put to Call and Volatility Data

Several weeks ago in Checking for Atheists, I talked about how bullish moves can be fueled by a large supply of non-believers who prefer to cling to a wall of worry in times of great uncertainty. These investors often prefer to wait until a bullish move is well established before they cautiously and reluctantly begin to resume long positions.

Volatility indicators, such as the VIX, usually provide an insight into just how worried these investors are, but put to call ratios do us one better: they give us a sense of their numbers. Right now, the numbers are compelling. As I noted in my weekly VIX recap, the ISEE data reflect all-time record lows of new call positions initiated relative to new put positions on the International Securities Exchange (ISE) over the past 20 days – a trend that has carried over to today’s session.

The other important put to call ratio that I follow closely is the CBOE’s equity put to call ratio ($CPCE on StockCharts.com), a chart of which I have included below. Like the ISEE, the CPCE is showing historically high level of puts to calls – in numbers not seen since early 2005. In the chart below, note that P/C readings of 0.70 or higher have consistently been good buying opportunities and today’s 10 day EMA of 0.73 has not been surpassed since May 2005.

Several readers have asked about the significance of a divergence between volatility and put to call readings. As I discussed last May in More Thoughts on the PCVXO, divergences in which volatility readings are much higher than put to call numbers are usually bullish, while the current situation, with put to call numbers much higher than volatility data, tend to resolve in a bearish move going forward.

VWSI at +1 as Put to Call Numbers Raise Eyebrows

It may sound strange given all the market drama that has played out so far this year, but 2008 has been a relatively uneventful year so far for those who follow the VIX. Sure there was that two day blip where the VIX traded in the mid-30s during January 22-23, but even then the action in the VIX paled in comparison to everything else that was hitting the fan across the investment universe.

Last week was more of the same. The markets bounced, albeit weakly, and the VIX dropped 5.06 points (17.4%) to end the week at 24.02. While the VIX move looks impressive on paper, it merely brought the volatility index right back to the 50 day simple moving average. The VWSI is also largely discounting last week’s drop in the VIX, as it ticked up from zero +1.

As is my weekly custom, for a survey of the best in current thinking about the markets, Barry Ritholtz at The Big Picture sums up the week that was and the week that is on tap in his Superbowl Linkfest.

Getting back to the VIX and the VWSI, while these numbers are unremarkable, the action in the ISEE suggests that tectonic forces are indeed at work just under the surface, with the ISEE’s 20 day SMA just missing an all-time low on Friday.

(Note that in the above temperature gauge, the "bullish" and "bearish" labels apply to the VIX, not to the broader markets, which are usually negatively correlated with the VIX.)

Wine pairing: For a VWSI of +1, I recommend a guwurztraminer. My favorite American version of this wine is the dry gewurztraminer from Londer Vineyards of Anderson Valley. I have not yet sampled the 2006 vintage, but the 2005 was an unforgettable wine that I would love to see in a blind tasting against some of the top Alsatian competition.

In my previous roundup of California gewurztraminer, I suggested Navarro and Harvest Moon. For some of my top selections from Alsace, check out Trimbach; Hugel; and Domaine Weinbach. You can also check out the top-rated gewurztraminers in the 2007 San Francisco Chronicle Wine Competition.

DISCLAIMER: "VIX®" is a trademark of Chicago Board Options Exchange, Incorporated. Chicago Board Options Exchange, Incorporated is not affiliated with this website or this website's owner's or operators. CBOE assumes no responsibility for the accuracy or completeness or any other aspect of any content posted on this website by its operator or any third party. All content on this site is provided for informational and entertainment purposes only and is not intended as advice to buy or sell any securities. Stocks are difficult to trade; options are even harder. When it comes to VIX derivatives, don't fall into the trap of thinking that just because you can ride a horse, you can ride an alligator. Please do your own homework and accept full responsibility for any investment decisions you make. No content on this site can be used for commercial purposes without the prior written permission of the author. Copyright © 2007-2023 Bill Luby. All rights reserved.
 
Web Analytics