Showing posts with label PCVXO. Show all posts

Monday, February 4, 2008

Divergence Between Put to Call and Volatility Data

Several weeks ago in Checking for Atheists, I talked about how bullish moves can be fueled by a large supply of non-believers who prefer to cling to a wall of worry in times of great uncertainty. These investors often prefer to wait until a bullish move is well established before they cautiously and reluctantly begin to resume long positions.

Volatility indicators, such as the VIX, usually provide an insight into just how worried these investors are, but put to call ratios do us one better: they give us a sense of their numbers. Right now, the numbers are compelling. As I noted in my weekly VIX recap, the ISEE data reflect all-time record lows of new call positions initiated relative to new put positions on the International Securities Exchange (ISE) over the past 20 days – a trend that has carried over to today’s session.

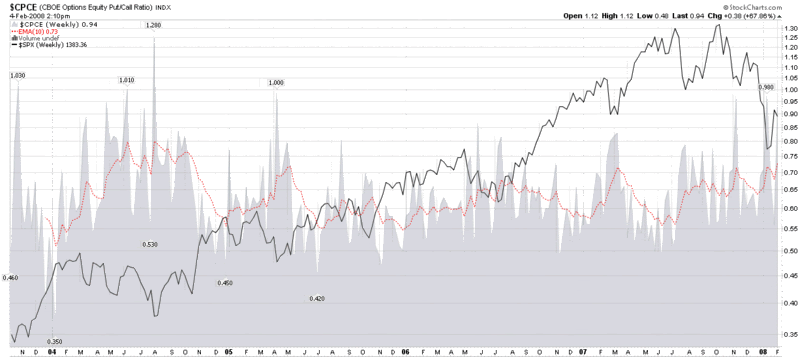
The other important put to call ratio that I follow closely is the CBOE’s equity put to call ratio ($CPCE on StockCharts.com), a chart of which I have included below. Like the ISEE, the CPCE is showing historically high level of puts to calls – in numbers not seen since early 2005. In the chart below, note that P/C readings of 0.70 or higher have consistently been good buying opportunities and today’s 10 day EMA of 0.73 has not been surpassed since May 2005.

Several readers have asked about the significance of a divergence between volatility and put to call readings. As I discussed last May in More Thoughts on the PCVXO, divergences in which volatility readings are much higher than put to call numbers are usually bullish, while the current situation, with put to call numbers much higher than volatility data, tend to resolve in a bearish move going forward.
Tuesday, January 15, 2008

When Volatility and Put to Call Activity Diverges

A reader asked whether I think tracking the ratio of the VIX to the ISEE has any value in terms of market timing.

I track indicators that sum relative volatility and put to call activity as well as a couple that examine the ratio of volatility to put to call action. For the most part, these two categories of sentiment indicators tend to confirm each other. Further, when volatility and put to call numbers signal the same extreme sentiment across both dimensions at the same time – as is usually the case – this dramatically increases the expected value of a number of contrarian setups.

Strong divergences between volatility and put to call activity are relatively rare. I did blog about this type of divergence at the end of May 2007, just before the VIX started upward on a path that would see it triple in less than three months. For the record, my conclusion at that time, which continues to be supported by the data I collect, is that “high readings of volatility relative to put to call data are generally bullish for the broad markets while high readings of put to call data relative to volatility are generally bearish for the broad markets.”

In looking at the ISEE numbers, keep in mind that this is a call to put ratio, so that if one wishes to compare the VIX to the ISEE, it is best to invert one of the numbers before putting them under a microscope and studying their Brownian motion

Tuesday, September 11, 2007

ISEE Buy Signal Coming, But Is It Tradeable?

Updating a previous post, it now looks as if the September ISEE buy signal I was anticipating two weeks ago will arrive as soon as Friday.

I’m sure traders across the globe are bursting with excitement, anxiously counting down the minutes until the ISEE tells them to rush headlong into the markets. But really now, is all this faux buildup worth the effort?

Just in time to answer this question, Michael Stokes at MarketSci.com has looked at the total put to call ratio as a timing tool in a three part series, published today. In short, MarketSci concludes that while the total put to call ratio has some predictable patterns, translating that knowledge into a winning trading system is non-trivial. In the end, they find that the put to call data can be successfully be used to enhance at least one SPX crossover system.

A couple of comments are in order.

First, when it comes to put to call ratios, I have a preference for the ISEE over all the other ratios because they only count opening options purchases. My second choice would be the CBOE’s equity put to call ratio. Third and fourth would be the total put to call ratio (this sums the equity and index put to call data and was used in the MarketSci study) and the index put to call ratio. The theory is that individual investors are more likely to trade options on individual equities, while large institutions will have disproportionate involvement in index options. (Note that the ISEE has recently started breaking out an equities only ratio, but since this data does not go back very far, I do not yet use it.)

Second, put to call ratios are a great tool. So are volatility indicators like the VIX. It always makes sense to look at these two indicators in concert, as I have talked about vis-a-vis the PCVXO and my own version of this indicator, which I have dubbed the PCEVXO.

Third, I recently reviewed an analysis by the CXO Group of the ISEE and CBOE total put to call ratio. You can follow the links in the previous sentence to read their original analysis, but the bottom line is that they were not enthusiastic about either tool, particularly the total put to call ratio.

Fourth, there are a number of books that offer an excellent treatment of put to call ratios; I will only mention three here. Bernie Schaeffer lays out some of his thinking about put to call ratios in Rick Bensignor’s New Thinking in Technical Analysis; Larry Connors and Connor Sen offer an excellent statistical analysis in How Markets Really Work; and Gary Smith explains his thinking and recommends some models of his own in How I Trade for a Living.

So…read, analyze and test. The answers are out there. And have your finger on the buy button Friday, just in case.

Tuesday, August 14, 2007

Touching Base with the PCEVXO

Given the current state of volatility, many market participants believe that the while the volatility indices are printing some extreme numbers, these are somewhat mitigated by the rather mild moves in various put to call ratio data.

Of course, it depends upon which data you are looking at. If you examine at the CBOE’s equity put to call ratio, you see that equity put volume set a new single day record back on 7/26 and the ratio itself peaked on 8/1. The ISEE shows more persistent put buying that did not peak until 8/7.

I have previously mentioned the PCVXO in this space, an index developed by Jay Kaeppel that combines the put to call and volatility data into one aggregate indicator. While I have no problem using the VXO, which is highly correlated to the VIX (as the OEX is to the SPX), I prefer two alternatives to Kaeppel’s recommended put to call ratio. Kaeppel uses the total put to call ratio, while I strongly prefer the CBOE’s equity put to call ratio or the ISEE. For the sake of clarity, I will refer to my refinements of the PCVXO as the PCEVXO and ISEEVXO, respectively, going forward.

Enough with the nomenclature. What are these indicators telling us?

Looking at the PCEVXO, it printed an all-time high on 8/6 and has been extremely overextended ever since, resulting in a very strong bullish signal for the markets. Not surprisingly, the VXO component of that indicator set new records on 8/9, 8/10 and 8/13. For comparison purposes, the PCE portion of the indicator set a new record on 8/6 and has been dropping slowly ever since. Interestingly, given the magnitude of the VXO readings, the divergence between the record VXO and merely very high PCE has also been at an all-time high for the last two sessions. As discussed back in May, when there is a strong divergence, this is also a bullish signal.

In summary, while you should never ignore all the red numbers on your screen, volatility and put to call data indicate that the current situation is the best contrarian buying opportunity during the four years for which there is PCEVXO data. That being said, stops and protective puts are always a good idea, particularly in skittish markets.

I suspect that those who are profiting from fear and panic can keep up the negative news flow through Friday’s options expiration. After that, the back to school sale should be over.

Tuesday, May 29, 2007

More Thoughts on the PCVXO

Last week I talked a little about the PCVXO, which combines put to call ratios and volatility data in one sentiment indicator. In crunching numbers on the original PCVXO system and a number of variants, I have concluded that the PCVXO family can be an effective market timing device. For those who may be wondering whether they should invest some time and energy in an effort to better understand of the PCVXO, I can offer my encouragement, along with a couple of tidbits from my research.

In a previous post, I described some of the trading rules advocated by Jay Kaeppel, the developer of the PCVXO. Kaeppel recommends initiating positions when the PCVXO re-crosses the 110 and 90 levels, in order to catch the remaining portion of the mean-reverting move. While various backtesting methods indicate that this does produce good results for both long and short positions, it is possible to miss a large portion of the mean-reverting move if the PCVXO happens to spike above 120 or even 130, as was the case with some PCVXO family systems following the February 27th spike in volatility. For this reason, I recommend timing entries to coincide with the first drop or second consecutive drop in the PCVXO once it crosses the 110 threshold. This approach will result in an earlier entry and a better chance of catching a larger portion of the big mean-reversion waves. A similar strategy is also effective below the 90 level, but because extreme low readings in the PCVXO tend to be much milder than extreme high readings, the incremental gains from this strategy are much smaller.

One particularly interesting aspect of PCVXO calculations is that it gives me an opportunity to evaluate what happens when the put to call and volatility data diverge. In a nutshell, my findings are that high readings of volatility relative to put to call data are generally bullish for the broad markets while high readings of put to call data relative to volatility are generally bearish for the broad markets. This is not what I would have expected, which makes the data even more interesting…and raises quite a few additional questions.

Finally, in light of the above, it seems worth noting that there was a significant divergence in the put to call and volatility data as recently as last week. Given that it was low put to call numbers that contributed to the divergence, this should be a bullish sign for the markets.

Friday, May 25, 2007

PCVXO: Combining Put to Call Ratios and Volatility Data

I talk a lot about put to call ratios and the VIX in this space, but I almost always talk about them as separate indicators and haven’t spent much time dedicated to discussing when to give one precedence over the other, what to do when the two indicators disagree, etc.

As luck would have it, Jay Kaeppel, who is the author of several books on options and a frequent contributor to Optionetics.com, has already written about one such model, which he calls the PCVXO. The name refers to the fact that the PCVXO combines a put to call ratio and the VXO. Essentially, the PCVXO boils down to an average of the ratios of the 10 day simple moving average to the 65 day simple moving average for both the put to call and VXO. The full details of the PCVXO calculations and buy/sell rules are available in Kaeppel's “Can We Bounce Yet: Part II.” You can also try a full search on “PCVXO” at Optionetics.com to get more information.

Like its components, the PCVXO is a contrary sentiment indicator, so it generates buy recommendations when a combination of relatively high put activity and increases in volatility signal excessive bearishness and fear. Likewise, when relative put activity and volatility are in a downtrend and suggest that greed and complacency are figuring prominently into the markets, the PCVXO is most likely to generate sell signals.

Kaeppel says that he uses the total put to call ratio and the VXO because there is a much larger quantity of historical data for these measures than for some of the alternatives. Of course, there are many possible permutations and combinations for indicators that are similar to the PCVXO. I generally prefer the ISEE and the equity put to call ratio to the total put to call ratio (or the index put to call ratio.) I also favor the VIX over the VXO, but believe that the VXN, RVX and VXD are all worth evaluating in the context of a combined sentiment indicator. Finally, there are an almost infinite number of simple and exponential moving averages to consider, but four of my favorite for sentiment data are the 5, 10, 20 and 50 day SMAs. With 4 put to call ratios, 5 volatility measures and 6 moving averages (that’s four factorial for those scoring at home), that means 120 ‘off the shelf’ combined put to call and volatility indicators.

I have been crunching numbers on quite a few of these PCVXO analogs and will have some more to say about this indicator next week.

DISCLAIMER: "VIX®" is a trademark of Chicago Board Options Exchange, Incorporated. Chicago Board Options Exchange, Incorporated is not affiliated with this website or this website's owner's or operators. CBOE assumes no responsibility for the accuracy or completeness or any other aspect of any content posted on this website by its operator or any third party. All content on this site is provided for informational and entertainment purposes only and is not intended as advice to buy or sell any securities. Stocks are difficult to trade; options are even harder. When it comes to VIX derivatives, don't fall into the trap of thinking that just because you can ride a horse, you can ride an alligator. Please do your own homework and accept full responsibility for any investment decisions you make. No content on this site can be used for commercial purposes without the prior written permission of the author. Copyright © 2007-2023 Bill Luby. All rights reserved.
 
Web Analytics