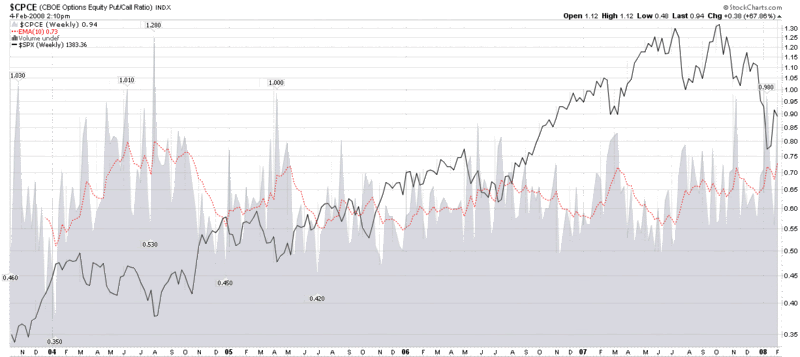
Divergence Between Put to Call and Volatility Data
Several weeks ago in Checking for Atheists, I talked about how bullish moves can be fueled by a large supply of non-believers who prefer to cling to a wall of worry in times of great uncertainty. These investors often prefer to wait until a bullish move is well established before they cautiously and reluctantly begin to resume long positions.
Volatility indicators, such as the VIX, usually provide an insight into just how worried these investors are, but put to call ratios do us one better: they give us a sense of their numbers. Right now, the numbers are compelling. As I noted in my weekly VIX recap, the ISEE data reflect all-time record lows of new call positions initiated relative to new put positions on the International Securities Exchange (ISE) over the past 20 days – a trend that has carried over to today’s session.
The other important put to call ratio that I follow closely is the CBOE’s equity put to call ratio ($CPCE on StockCharts.com), a chart of which I have included below. Like the ISEE, the CPCE is showing historically high level of puts to calls – in numbers not seen since early 2005. In the chart below, note that P/C readings of 0.70 or higher have consistently been good buying opportunities and today’s 10 day EMA of 0.73 has not been surpassed since May 2005.
Several readers have asked about the significance of a divergence between volatility and put to call readings. As I discussed last May in More Thoughts on the PCVXO, divergences in which volatility readings are much higher than put to call numbers are usually bullish, while the current situation, with put to call numbers much higher than volatility data, tend to resolve in a bearish move going forward.


4 comments:
So..are you bearing or bullish going forward........you laid the arguement for both?
Please explain!!
I am more bullish than bearish for the short to intermediate term, although the divergence suggests that this may be betting against historical precedent.
More than anything else, however, I am selling premium right now.
Cheers,
-Bill
Bill,
In 1996, when we peons first got access to both VIX and CBOE P/C ratios on a timely basis, I concluded that the "boyz" fooled us some days and sometimes with one of those numbers and sometimes with the other. In my simple mindedness I decided to combine them by simply multiplying the daily combimed CBOE P/C ratio by the (now) VXO. To smooth it a bit, but not too much, I chose a five day running total of the daily products. In honor of my chat sites nickname I called it the 2C Sentimeter or 2CS. As an old-timer, I did it by hand in 1996 and still do every day. And I have stuck with VXO as a result.
It is very useful as a measure of just how bullish or bearish people really are as measured by their enthusiasm for puts or calls and the volatility they induce by their enthusiasm.
Divergences in 2CS do occur at peaks and lows which are contrary to conventional sentiment analysis. I have a note taped to one monitor which says "sentiment divergence happens". Also range shifting occurs. When changing from a bull to bear or vice versa, the 2CS extremes in either direction are modified in a step wise fashion.
There are even better ways to use these daily data, and I'm sure that "the boyz" have them. But 2CS continues to give me a small window through which to track them.
I love your site,,,,cheers!
Tom
Hi Tom,
Thanks for sharing your thinking about the 2CS, which demonstrates one of the reasons I have included your Putting the Pieces Together in my blogroll.
FWIW, I also combine the put to call and volatility data and have discussed this in three articles in particular:
1) PCVXO: Combining Put to Call Ratios and Volatility Data
2) More Thoughts on the PCVXO
3) Touching Base with the PCEVXO
Lately I have been spending more time with the ISEE Equity Only data and the VXN -- and will probably be talking in the not too distant future about how these might be aggregated and analyzed.
Cheers and thanks for weighing in here,
-Bill
Post a Comment