Bullish NASDAQ TRIN Signal
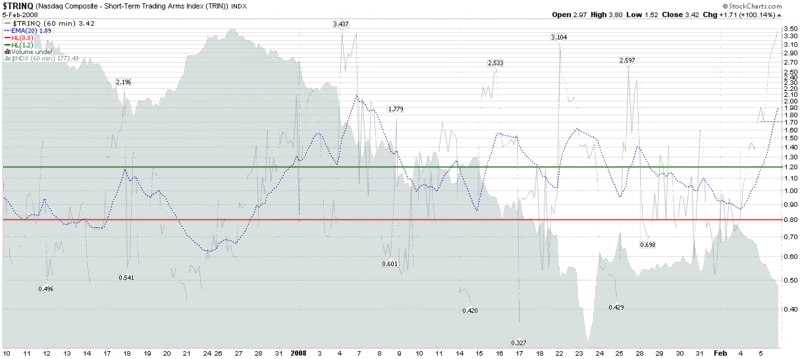
One of my favorite contrarian sentiment indicators is the (NYSE) TRIN and it’s NASDAQ counterpart, which StockCharts.com (responsible for the chart below) codes as the $TRINQ.
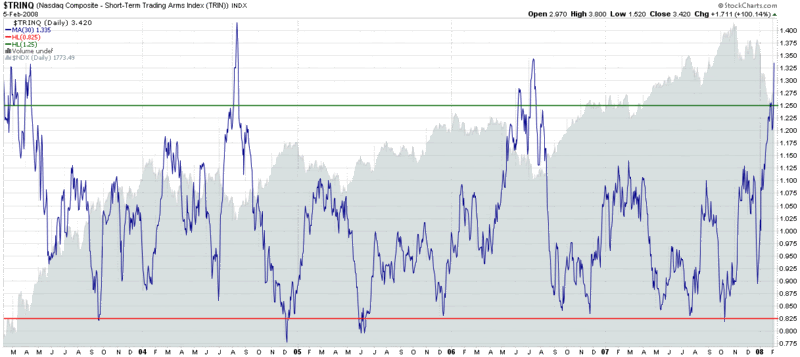
The chart I have chosen for today [Edit: updated EOD chart is first chart below; 2nd chart provides longer historical context] uses 60 minute bars over the past two months to demonstrate that in spite of the recent bounce, today’s action sets up another bullish contrarian buy signal – at least in the NDX. This signal looks stronger if you consider the possibility of some support in the 1780 area. Take this with a grain of salt, but consider that the TRINQ’s track record has been very strong as of late.
Also consider that more generally, it may pay to fade any strong move that develops in the current environment of uncertainty – and perhaps to sell premium just beyond important support and resistance levels.


[source: StockCharts.com]


2 comments:
Chart... Thanks!
Photobucket is down at the moment. When it is back up, I will make sure the chart is up and running. TRINQ is 3.23 at the moment. VERY high.
Cheers,
-Bill
Post a Comment