Showing posts with label TRIN. Show all posts

Sunday, June 6, 2010

Chart of the Week: Weekly Volume Flow

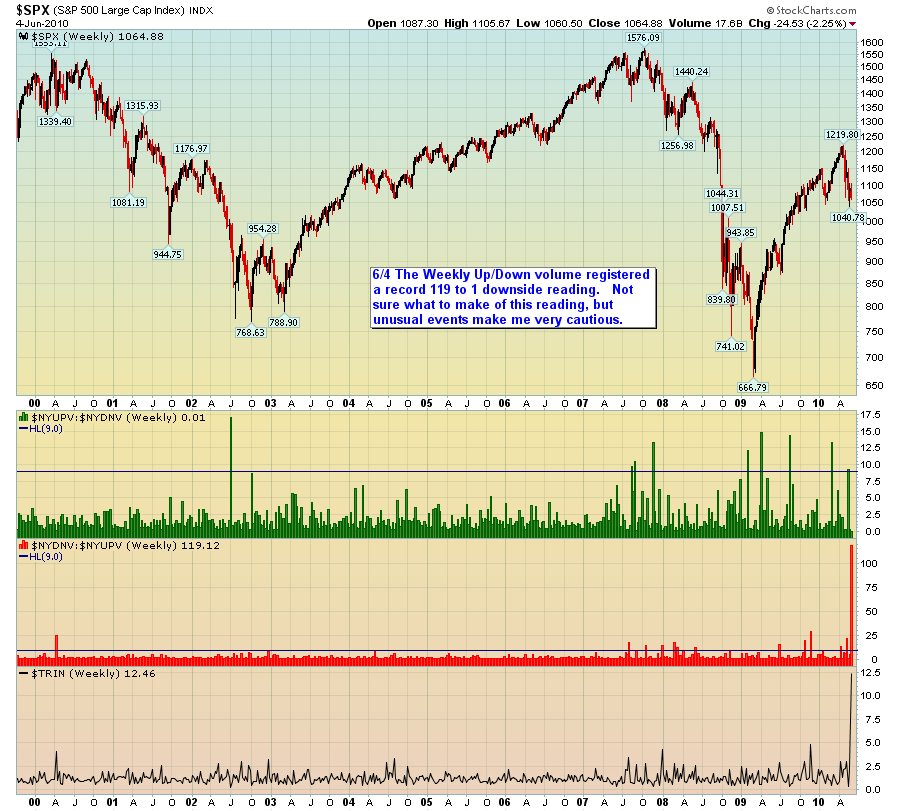
Thanks to Charlie Thompson for submitting this week’s winning chart of the week entry. Once again there were quite a few very strong entries. Perhaps because I have lately been focusing much of my trading research and development in the area of volume and perhaps because I see so little top notch analysis of volume patterns, I found Charlie’s chart to be particularly compelling. Also, I tend to place most of my emphasis on short and intermediate-term data and analysis in this blog – and given the events of the past month or so, I think the present is an excellent time to step back and view the investment landscape with a wide angle lens.

For the record, $NYUPV is the total volume of all advancing stocks on the NYSE and $NYDNV is the total volume of all declining stocks on the NYSE. The green bars thus represent a ratio of $NYDNV to $NYUPV. The TRIN is also known as the Arms Index. I discuss the how the index is calculated in Bullish TRIN as Year Winds Down.

For his efforts, Charlie also wins a free one year subscription to Expiring Monthly: The Option Traders Journal.

As I did the last time around, I will also highlight some of my other favorite entries in the next few days. For those who may be interested, the March winner and three honorable mention charts can be found in the links below.

For more on related subjects, readers are encouraged to check out:


[source: StockCharts.com and Charlie Thompson]

Disclosures: I am one of the founders and owners of Expiring Monthly

Sunday, October 4, 2009

Chart of the Week: NASDAQ TRIN

The NASDAQ TRIN is an indicator I generally hear very little about, yet in a market where technology stocks have been leading many of the advances and decline, one that I believes deserves closer scrutiny.

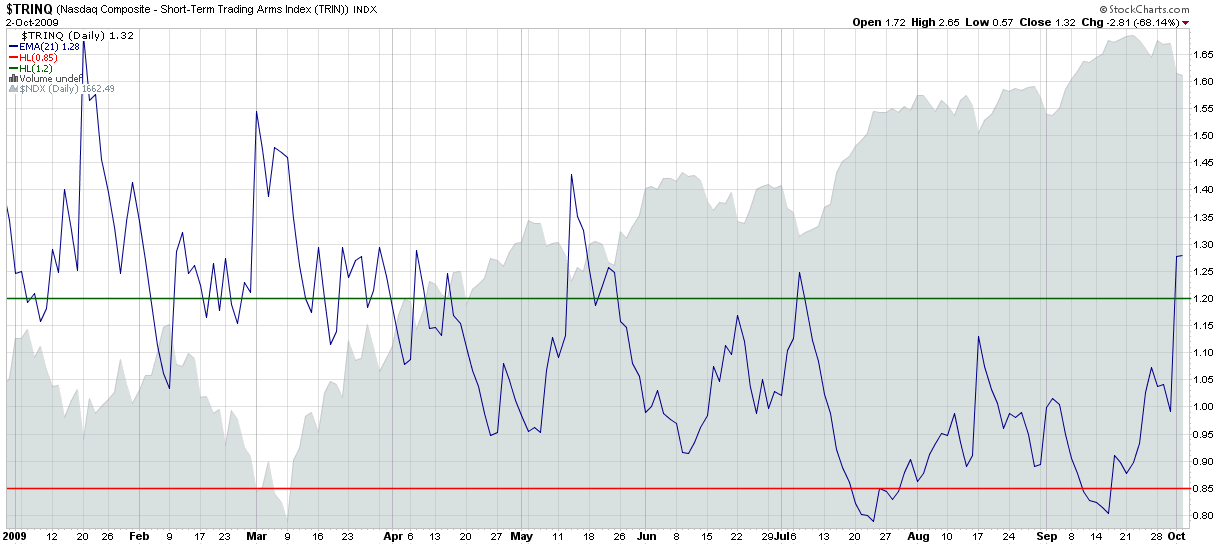
In this week's chart of the week below, I show a simple NASDAQ TRIN chart that uses a 21 day exponential moving average to smooth out some of the daily noise that is common in short-term studies of this indicator. As a contrarian market sentiment indicator, the TRIN is useful for helping to identify market turning points or the potential for near-term reversals.

The chart below shows that since the markets settled down and bottomed in early March, the NASDAQ TRIN has been adept at signaling buying points (below the green horizontal line) and selling points (above the red horizontal line.) Friday’s EMA-smoothed reading of 1.28 is the highest since the mid-May bottom and suggests that the current pullback may be another good buying opportunity.

Whether or not you agree with the buy on the dip approach at the moment, you should make an effort to keep an eye on the NYSE TRIN (a.k.a. the Arms Index) and the NASDAQ TRIN as market timing signals.

For additional reading on the TRIN and the NASDAQ TRIN, readers are encouraged to check out:

[source: StockCharts]

Wednesday, August 5, 2009

CBOE Equity Put to Call Ratio in Bear Territory

Lately I have been dipping my toe in the water on the short side – only to discover that something resembling an alligator seems intent on severing my leg at the ankle. Fortunately, I have managed to keep the stakes low to this point, but during today’s session I took a much more aggressive stance and bought a large quantity of puts.

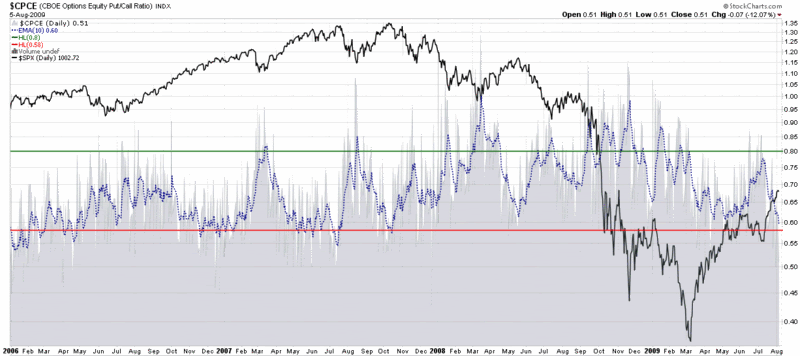
In the process of reshaping my thinking, I found two indicators in particular to be persuasive. The first is the TRIN, where I am partial to using a 10 day EMA to smooth the data. Today it closed at a level seen only once since the beginning of 2006, just as the market put in a short-term top after a week and a half of bouncing off of the March lows.

Even more persuasive is the CBOE equity put to call ratio (CPCE), where the 10 day EMA hit a low of 0.51 – a level which has not been seen since the October 2007 top. The chart below shows that a low CPCE warned of excessive optimism and the possibility of a top first in July 2007, when the SPX began to form the first half of a double top and again in October 2007, just as the market was topping for the second and final time.

For a different take on today’s CBOE equity put to call ratio, I can highly recommend 08/05/09 Market Recap: CPCE a little too low again, from Cobra’s Market View.

For some related VIX and More posts on the CPCE, try:


[source: StockCharts.com]

Wednesday, December 3, 2008

Arms Index Going Back to 1992

I’m glad to see that yesterday’s Arms Index Extremely Extended post received so much attention.

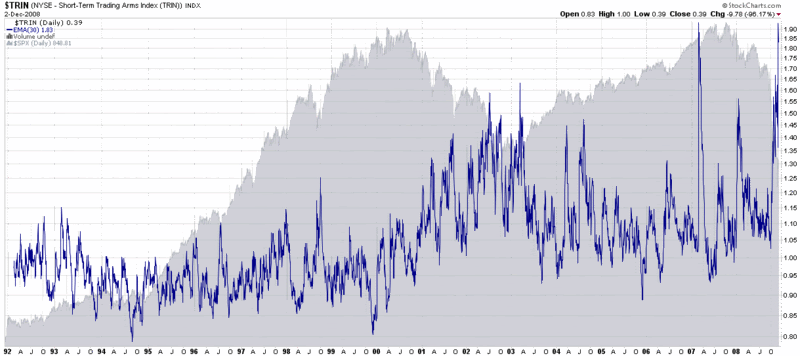
One of the concerns raised by a reader was that my chart of the Arms Index (TRIN) only looked back to four years of history, so that the historical context prior to the current bear market consists entirely of bull market readings. For this reason, today’s chart goes all the way back to the beginning of TRIN data available at StockCharts.com.

In the chart below, the 17 years of TRIN data results in such compressed and difficult to read 10 day EMA cycles that I have lengthened the exponential moving average period from yesterday’s 10 days to a 30 day EMA. Fortunately, because it is an EMA instead of an SMA, the peaks in the TRIN cycles are almost identical whether the EMA period is 10, 30 or 50 days.

I have also removed the red and green horizontal lines from this long-term chart to reflect the fact that the TRIN had a lower mean prior to 2000, trended higher during the bear market from 2000-2003, and seems to have found a new mean value from 2004 through 2008. For this reason, considered over the course of multi-year time frames, the TRIN is best thought of in relative terms rather than absolute terms.

As I noted with yesterday’s chart, spikes in the TRIN have “historically provided excellent buying opportunities.” Low TRIN readings may also have some value from a market timing perspective, but these signals are generally not as robust as high TRIN readings. Finally, the TRIN is far from perfect in predicting market inflection points, but it does have a track record that is accurate enough to bear watching. As I noted yesterday, the TRIN is best suited for short to intermediate-term setups.


[source: StockCharts]

Tuesday, December 2, 2008

Arms Index Extremely Extended

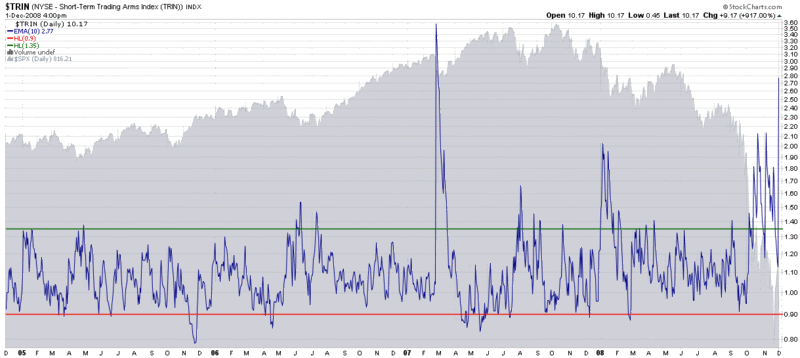
The Arms Index or TRIN is an indicator that I watch closely for short to intermediate-term setups. The indicator which combines ratios of advancing issues to declining issues and advancing volume to declining volume is a reasonably reliable contrary signal.

Since mid-October the Arms Index has been generating a number of historically high signals. In the chart below, I used a 10 day exponential moving average as a smoothing factor. Note that the TRIN’s 10 day EMA appears to have climaxed yesterday in the manner that has historically provided excellent buying opportunities. To my ears, yesterday’s climax in the TRIN is suggesting that the November 21st bottom is likely to hold. Shorts beware…

[source: StockCharts]

Monday, March 3, 2008

Put to Calls and TRIN More Skittish than VIX, VWSI

A quick programming note: henceforth, I am going to be a little more freeform with my end of week commentary, making it less VIX and VWSI-centric. Lately the VIX has been at best a sub-plot in the market turmoil and the VWSI has not generated any extreme readings, so I will be expanding my weekly scope to include some of my other favorite indicators: put to call ratios, market breadth data, TRIN numbers, etc. going forward – or whatever else looks to be most newsworthy.

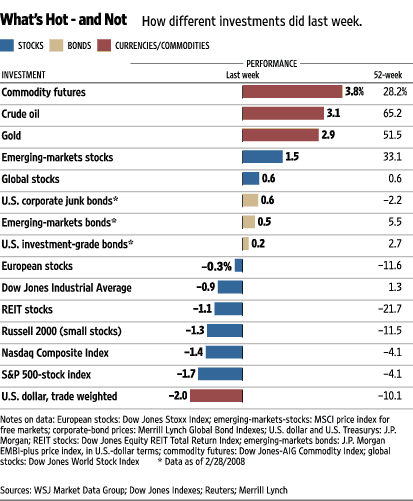
The Wall Street Journal “What’s Hot and Not” graphic shows where the action was last week – and this story is starting to look familiar. Oil, gold and other commodities were the biggest gainers last week, with a weak dollar and a weak US stock market accounting for the biggest losers.

The VIX ended the week up 2.48 (+10.3%) to 26.54, with the VWSI slipping back to zero. More interesting was the action in the put to call data, where the ISEE set all-time records lows for the 20, 50 and 100 day moving averages each day from Tuesday through Friday and the CPCE (CBOE Equity Put to Call Ratio) hit a new high of 1.50. In the wake of Friday’s precipitous drop, the TRIN and NASDAQ TRIN also ended the week with extreme readings of 2.46 and 2.76, respectively.

All this continues to mean one of two things: either the market is extremely oversold and anxious investors are going to create a massive wall of worry for a nice rebound…or we are in the midst of a financial meltdown not seen in the lifetime of most investors. I continue to reside in the former camp, but am watching SPX 1310 and NDX 1725 for signs of additional cracks in the dike.

Wednesday, February 6, 2008

Mean Reversion After Big Drops

Eddy Elfenbein at Crossing Wall Street has a nice little graphic and commentary up today: How the Market Behaves on Big Down Days.

After researching the 37 instances in which the S&P 500 index dropped 3.2% or more (as it did yesterday), Elfenbein draws the following conclusions:

“The average loss for the sell-off is 5.01%. After that, nearly every day is an up day. By the ninth day, the S&P 500 is down 3.48%, which is indeed, a retracement of about one-third. The market still trends higher to the 17th day where it's down just 3.01%, or about a 40% retracement. At that point, the linger effects of the sell-off seem to dissolve.”

Elfenbein’s findings should come as no surprise to those who pay attention to the TRIN and ISEE, as well as the VIX, various market breadth indicators, etc. While volatility has been on the tame side lately, the TRIN, ISEE, and McClellan Summation Index have all been suggesting a strong oversold situation and a high probability mean reversion bullish entry.

The duration of the retracement pattern identified by Elfenbein is also worth noting, as it hearkens back to some work on VIX spike retracements I published last April in Lessons from the Post-2/27 VIX Price Action, where the optimal retracement window was determined to be about eight days.

Tuesday, February 5, 2008

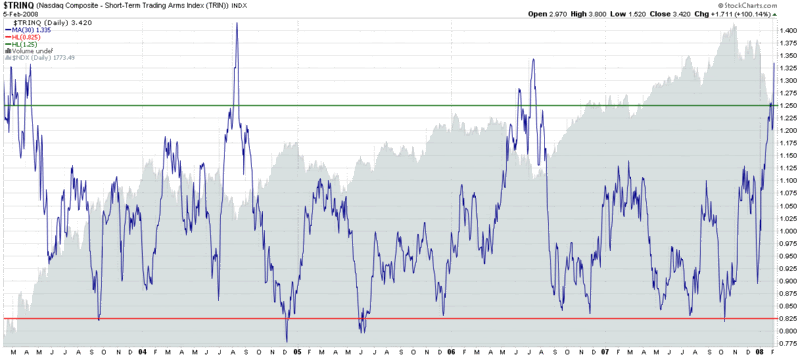
Bullish NASDAQ TRIN Signal

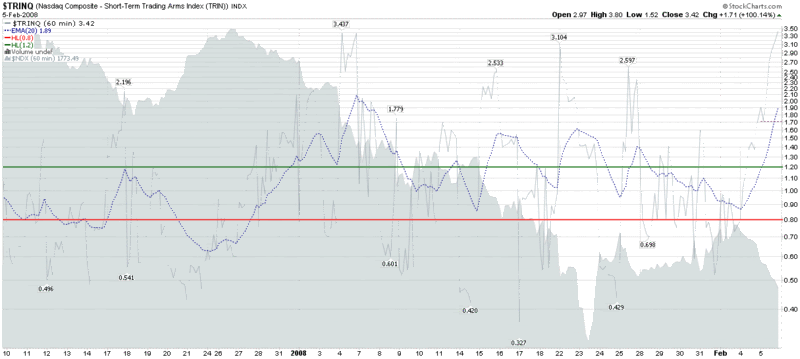
One of my favorite contrarian sentiment indicators is the (NYSE) TRIN and it’s NASDAQ counterpart, which StockCharts.com (responsible for the chart below) codes as the $TRINQ.

The chart I have chosen for today [Edit: updated EOD chart is first chart below; 2nd chart provides longer historical context] uses 60 minute bars over the past two months to demonstrate that in spite of the recent bounce, today’s action sets up another bullish contrarian buy signal – at least in the NDX. This signal looks stronger if you consider the possibility of some support in the 1780 area. Take this with a grain of salt, but consider that the TRINQ’s track record has been very strong as of late.

Also consider that more generally, it may pay to fade any strong move that develops in the current environment of uncertainty – and perhaps to sell premium just beyond important support and resistance levels.


[source:  StockCharts.com]

Tuesday, January 8, 2008

Arrow Up For Tomorrow

I generally shy away from making stock market predictions and prefer the Stuart Walton jellyfish approach to investing, but sometimes the markets get so egregiously out of whack that I feel obliged to state the obvious. In this case the obvious is that the probability of a short-term rally beginning tomorrow is extremely high.
Many of the overbought/oversold indicators that I study closely (ISEE, TRIN, VXN, etc.) suggest that the markets are ready for a bounce tomorrow. In short, tomorrow is setting up to be a mean reversion, oscillator lover's shooting gallery. Keep in mind, however, that if the markets do not make a U-turn into oncoming traffic, it is often more instructive to observe what the markets fail to do than what they actually end up doing.

In the jellyfish tradition, when a bounce arrives, I have no intention of trying to guess how long it will last. The important question is whether large investors will be selling into any rally to unload inventory before the bear market grip tightens – or if this may be the beginning of another periodic pullback in the continuing 5 ½ year bull trend.

As always, caveat emptor!

Wednesday, January 2, 2008

Selloff Overdone Prior to FOMC Minutes Release?

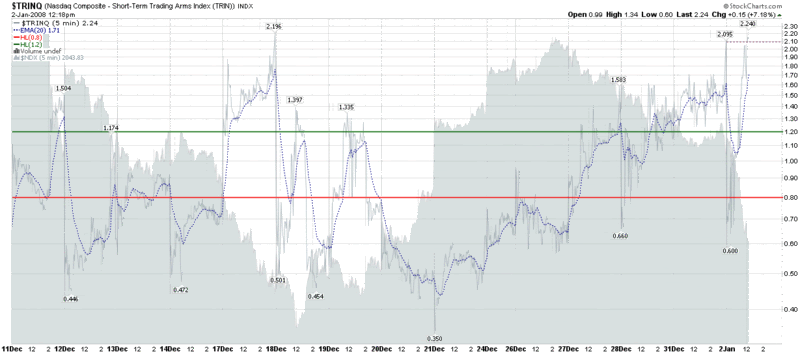
In the hour and 40 or minutes or so before the FOMC releases the minutes from their December meeting, I am using the market weakness to make some buys. I have a number of reasons for doing this, not all of which I am going to detail here. Instead, I will post a chart of the NASDAQ TRIN, the counterpart to the NYSE TRIN that I discussed a couple of days ago. TRIN numbers can be calculated for each exchange. I watch the NASDAQ closely because the NASDAQ often leads the NYSE in terms of determining speculative sentiment.

In the chart below, I use 5 minute bars over a 10 day range. My thinking, in a nutshell, is not that I can guess what the FOMC minutes will reveal, nor even how the market will react to it, but I suspect that if the news is considered bullish by traders, the market will move much more decisively than if the news is considered to be bearish.

I consider this a contrarian sentiment play, with an asymmetrical news reaction magnitude potential. From a probability perspective, it’s about a 50% play; from an expectation perspective, I think the numbers are solidly in my favor.

Monday, December 31, 2007

Bullish TRIN as Year Winds Down

One indicator that I have yet to comment on in 2007 is the TRIN, also known as the Arms Index, after its inventor, Dick Arms.

The TRIN is calculated by first dividing the number of stocks that advanced in price by the number of stocks that declined in price to determine the Advance/Decline Ratio. Next, the volume of advancing stocks is divided by the volume of declining stocks to determine the Upside/Downside Ratio. Finally, the Advance/Decline Ratio is divided by the Upside/Downside Ratio. In mathematical terms, the TRIN looks like:

(Advancing Issues / Declining Issues)

────────────────────────────

(Advancing Volume / Declining Volume)


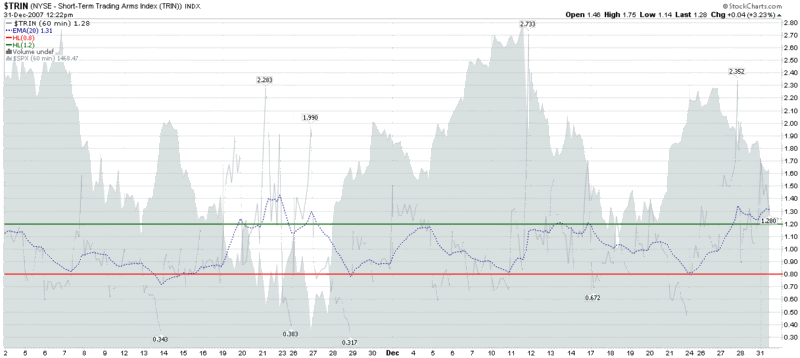
Like the VIX and put to call ratios, the TRIN is a contrarian sentiment indicator. Generally, a rising TRIN indicates increasing bearish sentiment and a falling TRIN reflects increasing bullish sentiment. I have included the traditional 1.2 and 0.8 thresholds as indicative of sentiment extremes. These are levels at which the probability of a market reversal increases.

Depending on their trading time frame, practitioners use different bars for the TRIN. In the chart below, I chose to use 60 minute bars over the course of a two month period to generate swing signals of the short to intermediate-term variety. For comparison purposes, day traders frequently use 5 or 10 minute bars. It is important to note that different length bars give very different signals and also usually require a rethinking of where one should place the threshold levels for market turns.

At the moment, the TRIN is generating a fairly bullish signal – certainly the most bullish signal since Thanksgiving, when the markets began a strong rally that surprised many who were not watching the TRIN closely.

I will have more on the TRIN in 2008.

DISCLAIMER: "VIX®" is a trademark of Chicago Board Options Exchange, Incorporated. Chicago Board Options Exchange, Incorporated is not affiliated with this website or this website's owner's or operators. CBOE assumes no responsibility for the accuracy or completeness or any other aspect of any content posted on this website by its operator or any third party. All content on this site is provided for informational and entertainment purposes only and is not intended as advice to buy or sell any securities. Stocks are difficult to trade; options are even harder. When it comes to VIX derivatives, don't fall into the trap of thinking that just because you can ride a horse, you can ride an alligator. Please do your own homework and accept full responsibility for any investment decisions you make. No content on this site can be used for commercial purposes without the prior written permission of the author. Copyright © 2007-2023 Bill Luby. All rights reserved.
 
Web Analytics