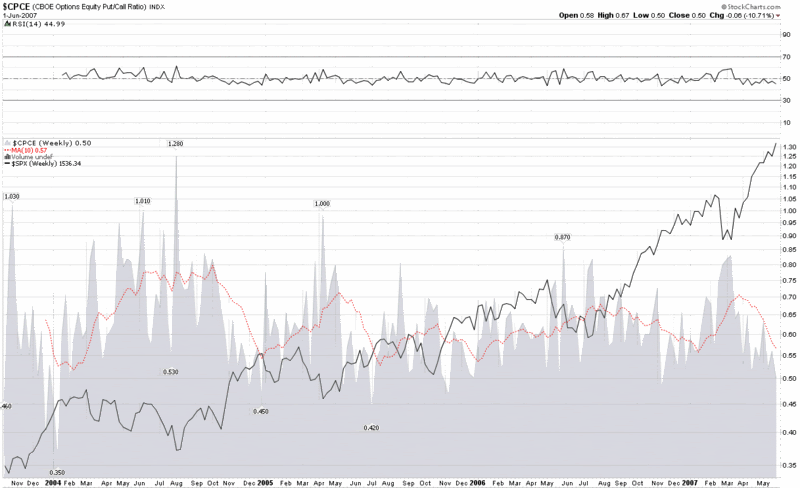
CBOE Equity Put to Call Ratio Poised to Print Warning
I am the first to admit that I intentionally give the ISEE top billing when it comes to put to call sentiment indicators. I should also point out that I am probably in the minority in doing so. I have spelled out my reasons for favoring the ISEE in the past, but today I am going to focus on a better known alternative, the CBOE’s equity put to call ratio.
I discussed the CBOE’s equity put to call ratio back in “A Sentiment Primer,” but I am returning to it today for a two reasons:
- it is much more widely followed than the ISEE;
- it is in the process of printing a significant bearish signal
Starting with the first point, the ISEE was officially launched on December 1, 2003, but the International Securites Exchange (ISE) has data going back to October 1, 2002. On the other hand, the CBOE has historical put to call data going all the way back to 1995, which means that for many years traders standardized on the CBOE put to call ratio and used it as their sole source for put to call sentiment data. Not surprisingly, the combination of a deeper historical database and longer personal experience with the data means that many still use the CBOE data today out of habit.
I should probably mention that the CBOE did not break out the equity put to call and index put to call data until October 21, 2003, but by this time they were already the well established leader and the ISEE has been playing catch up ever since.
Now to the more important part.
As the graph below suggests, when the 10 week SMA of the CBOE equity put to call ratio drops below 0.58, it has generally done a fairly good job of warning of coming market tops. Not only is the current reading down to 0.57, but as higher readings scroll off this week and beyond, you can anticipate that this ratio will go even lower. Should you be concerned? Well, even if you don’t put any stock in these types of ratios, be wary of those market watchers who do – and are prepared to take action.
If you wish to watch the equity put to call ratio more closely, SchaeffersResearch.com has a nice graph tool to play with and a data/graph snapshot to watch. StockCharts.com also has a much more comprehensive gallery graph for non-subscribers. Manic depressive traders (I know you’re out there) will probably prefer to get half hourly updates directly from the CBOE.


6 comments:
Thanks for the great post! So if .58 is thevel that could indicate a market top, what is the level that could indicate a market bottom?
I understand that this is just one indicator and should be used in conjunction with others, but I am just curios.
Thanks;
Adam in DC
Hi Adam,
Using that highly scientific tool known as eyeball inspection...I'd say that about 0.67 looks to be the best bet for calling tops. Higher numbers would be higher percentage calls, but something like 0.70 would only produce three signals in the 3 1/2 years covered by the carts, so I'm tempted to go with 0.67.
As an aside, I am usually too early in calling tops and bottoms (which is one of the reasons why I like to lean on indicators as much as possible.)
Cheers and good trading,
-Bill
[addendum]
And just to be clear, by 0.58 and 0.67, I mean a 10 week SMA of those numbers for the CPCE, not just a single week data point...
Anything one man can imagine, other men can make real.
2fMly http://www.cheapuggbootsan.com/
nIld http://www.michaelkorsoutletez.com/
vTmm http://www.cheapfashionshoesam.com/
4hNcx http://www.burberryoutletxi.com/
8rLct http://www.nflnikejerseysshopxs.com/
3bTut http://www.coachfactoryoutlesa.com/
8mJfo 1oHpp 2iZwj 9tXxr 3jXdj 0mKyq 7tQch 9gKhu 3sTym
Every weekend i used to go to see this web page, as
i wish for enjoyment, since this this web page conations in
fact fastidious funny data too.
My blog post; Air Max Pas Cher
I visited several blogs but the audio feature for audio
songs existing at this site is genuinely marvelous.
Also visit my weblog :: Chaussures De Football Pas Cher
Post a Comment