VIX and the Monthly Calendar
Early on in the life of this blog, when it looked as if volatility were dead and no one cared about the subject, I sliced and diced a bunch of VIX data in good ol’ Excel in an effort to identify some cycles that affect the VIX. Some of the results were particularly intriguing (the annual cycle and the FOMC cycle, for instance) and others were decidedly less enlightening.
One cycle I never got around to publishing the data for is the monthly trading calendar. The quarterly cycle and the options expiration cycle touch a little bit on the monthly cycle, but rather than interpolate at 30,000 feet, I think it is time to look at the monthly cycle more closely.
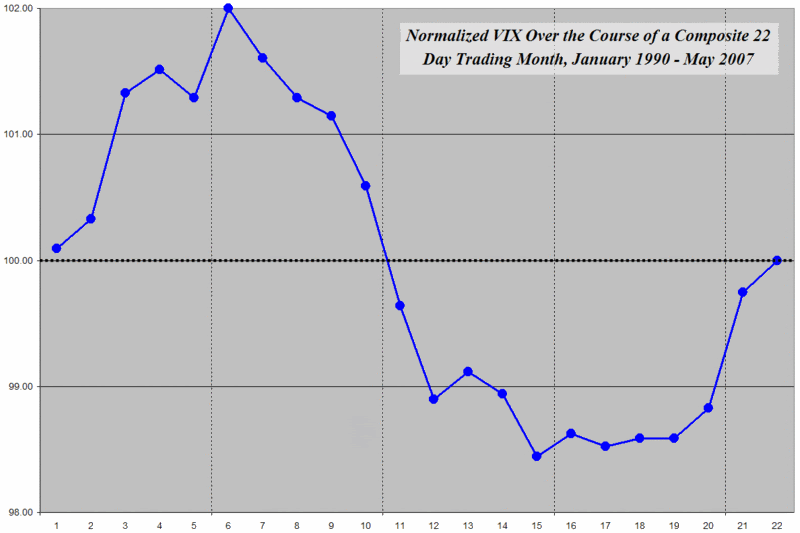
For those who may not be familiar with these charts, the graphic below translates a calendar month into a 22 day trading month, normalizes the VIX at 100, then aggregates VIX closing values for all the trading days from 1990 through yesterday. (I like to normalize the VIX in these graphs because it makes it easier to get a perspective on the magnitude of changes from point to point.)
From previous research on the options expiration cycle, I was not surprised by the dramatic fall in volatility for the week and a half or so prior to options expiration (which averages out to be the 13th trading day of each month.) I was, however, surprised to see the uptick in volatility at the end of each month that tends to run through the 6th trading day of the month. Given that the pattern of bullish moves in the markets at the end and the beginning of each month has been well documented by the likes of the Stock Trader’s Almanac and others, I was not expecting to see that the VIX tends to rise at the same time that the markets generally do the same. I have not yet developed a theory to explain this phenomenon, though I did present Bernie Schaeffer's theory a couple of months ago. As always, I encourage readers to offer their thoughts.
Finally, for those who may be interested in reviewing VIX price movements in the context of some other cycles mentioned previously on this blog, here is a short list of links to investigate:
- A Month by Month Look at the VIX
- VIX Performance During the Options Expiration Cycle (which I will be revisiting)
- VIX and the Quarterly Cycle
- VIX Price Movement Around FOMC Meetings
- The VIX on Mondays and Fridays
- The VIX on Mondays After Options Expiration


4 comments:
Hey Bill, are you familiar with wavelet or Fourier transforms? You could very quickly get the "frequencies" for your "epicycles" via either of these two methods.
-Michael J Bommarito II
Michael, thanks for the Fourier transforms and wavelets suggestion. I'm familiar with the concepts, but my math education never allowed me to formally wrap my arms around them. Of course, it's never too late to learn something new and useful...
BTW, I'm still mulling over your RVX-VIX comments. Good stuff; keep it coming!
Bill,
Interesting relationship. Can you display a vertical line through each point that would give us some idea of the variability for each data point (e.g., standard deviation)? Can you subject the points to a statistical test to see if the apparent difference between them is real?
jumpstart,
In the not to distant future (my favorite time frame for promises) I am going to re-do this analysis in such a way that makes it possible to answer your questions, which, unfortunately, cannot be properly answered with the way in which I transformed the data to create the normalized chart.
Yours are good questions and the data should be such that they yield a meaningful answer, otherwise it's just a pretty picture.
Cheers and good trading,
-Bill
Post a Comment