VIX Price Movement Around FOMC Meetings
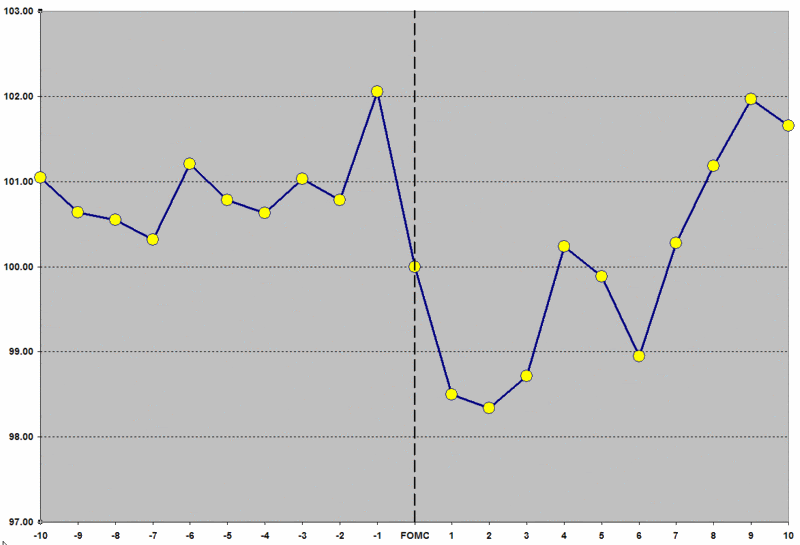
I looked at end of day price changes in the VIX covering a period of 10 days prior to the FOMC announcement to 10 days following the announcement, from 1990 to the present . I normalized the EOD VIX on announcement day at 100 to make for a more meaningful scale and the following picture jumped out at me:

The graphic tells the story rather succinctly and it suggests that it is wise to be short volatility on the day before the FOMC announce and to be long volatility the day after the announcement, with the expectation of a volatility mini-crush of sorts, on the order of about 3.5% -- with half of that move coming on announcement day and the other half of the move coming the day after the announcement.
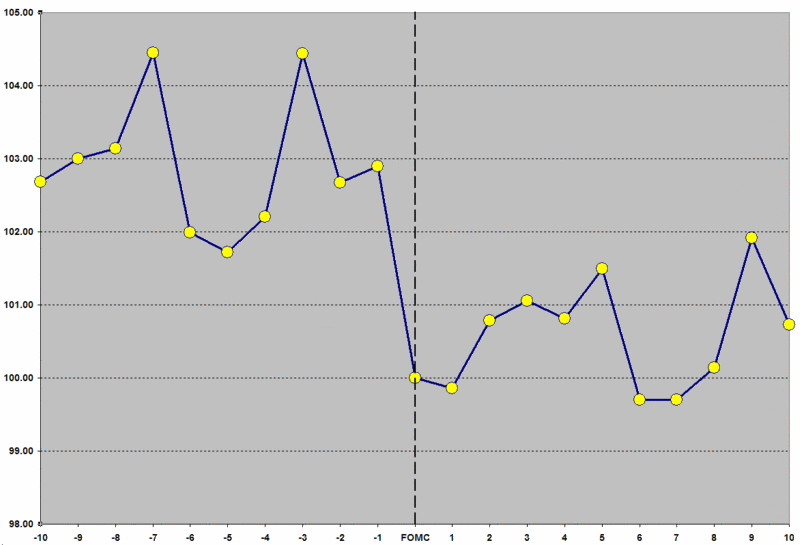
It turns out that Peter Carr and Liuren Wu published some similar observations in May 2004, so I checked to see if the publication of that information resulted in a change in the trend. To my surprise, the trend has remained relatively intact in the subsequent 21 data points over the past 2 ½ years:

Looking at the more recent data, the mini-crush has been closer to 3.0% since May 2004, but two key differences should be noted:
- Over 90% of the mini-crush has happened on announcement day, with very little movement on the subsequent day
- Volatility has no longer reverted to pre-announcement levels in the week or two following the announcement, rather it has remained lower post-announcement in the past 2 ½ years
Of course, there is considerable risk in jumping to conclusions that the 21 most recent data points are defining a new context for FOMC announcement volatility, but that possibility bears watching.


0 comments:
Post a Comment