Showing posts with label FOMC. Show all posts

Wednesday, May 18, 2016

Economic Data Surprise Index Shows Continued Weakness

Today we get another glimpse into the behind-the-scenes machinations of the “data dependent” Federal Open Market Committee (FOMC) with the release of the minutes from the April 26-27 meeting.

While the Fed has a dual mandate of maximum employment and price stability, lately there has been considerable discussion about the how much the Fed should let global considerations factor into Fed policy.  Clearly, the pace of economic growth in China or the stability of euro zone has a significant downstream effect on economic activity in the United States.  Additionally, with 48% of revenues from the S&P 500 companies coming from international markets, policy formulation in an increasingly interconnected global economy is becoming more complicated with each advance in technology, communications and logistics.

Given this backdrop, just how does the data look?  For the past seven years I have been publishing an economic data surprise index that aggregates U.S. economic data relative to consensus expectations across areas such as employment, the consumer, housing/construction, manufacturing and inflation.  The chart below aggregates data across all these areas and shows data peaking relative to expectations during October 2014.  Since that peak, however, economic data relative to expectations deteriorated sharply, falling to an all-time low during the middle of January 2016 that was matched again at the end of last month. 


[source(s):  VIX and More]

If the Fed is indeed data dependent, then there is no avoiding the conclusion that aggregate data relative to expectations has been a disaster for the past 1 ½ months.  There are some signs of stability forming in the current environment and clearly the strength of the dollar and the price of crude oil will have a great deal to say about economic data going forward.  Then again, international events such as the Brexit vote and the evolution of negative interest rate policies of central banks across the globe may trump all domestic U.S. economic data.

[Readers who are interested in more information on the component data included in this graphic and the methodology used are encouraged to check out the links below. For those seeking more details on the specific economic data releases which are part of my aggregate data calculations, check out Chart of the Week: The Year in Economic Data (2010).]


Related posts:


Disclosure(s): none

Sunday, January 25, 2015

The Year in VIX and Volatility (2014)

This is the seventh year in a row I have offered a retrospective look at the year in VIX and Volatility, which is my attempt to cram some of the highlights of the year in volatility onto one eye chart graphic with a (somewhat) manageable number of annotations.

In aggregate, 2014 was a very quiet year for the VIX, with a mean close of just 14.19 for the year, which is the lowest the VIX has been since 2006 and third lowest since 1995. On the other hand, as I recently documented, VIX spikes were common last year, with 2014 registering the third highest number of 20% VIX spikes since the beginning of VIX data, in 1990. In short, the VIX was susceptible to large spikes, but these were typically followed by strong mean-reverting declines. For example, the peak VIX of 31.06 on October 15 was the highest VIX reading since 2011, yet just six weeks later the VIX was back in the 11s.

When asked in October what they perceived as the biggest threat to stocks, respondents to the VIX and More fear poll pointed to the end of quantitative easing and the removal of the Fed safety net as their top concern, with Ebola narrowly edging out the much more nebulous “market technical factors” for the second slot. As best as I am able to determine, it was the panic associated with fears of an Ebola epidemic that took an already elevated VIX and pushed it up into the 30s.

At various times during the year, Ukraine/Russia, crude oil, ISIS/ISIL, Israel/Gaza, the Fed and the European Central Bank all managed to increase anxiety and perceptions of risk among investors. Also, the narrow miss in the vote for Scottish independence created turmoil in the United Kingdom and across the euro zone, but managed to avoid morphing into another nationalist crisis. Early in the year, there was a currency crisis in emerging markets that was triggered by (unfounded, in retrospect) concerns about higher interest rates in the U.S. Throughout the year there were concerns about valuations and excesses momentum trading in the likes of biotechnology, social media, internet and solar stocks. To some extent, these concerns peaked in April (see The Correction as Seen in the ETP Landscape for additional details), only to return periodically throughout the balance of the year.

The Year in VIX and Volatility 2014

[source(s): StockCharts.com, VIX and More]

Last year at this time, the prevailing worries were focused on whether or not Fed Chair Janet Yellen was leaning toward a more hawkish stance, the inevitable march to higher interest rates in the U.S., the weakening of emerging markets currencies and the potential fallout from the Fed’s tapering of bond purchases. In retrospect, investors were largely worrying about the wrong things.

The first few weeks of 2015 have seen Greece, Saudi Arabia and Ukraine back in the spotlight, with the Swiss National Bank and European Central Bank dominating news on the central banking front. If the past is any guide, the big issue for 2015 has yet to rear its ugly head, whether it turns out to be a gray, charcoal or black swan.

Related posts:

Disclosure(s): none

Top Posts of 2014

Since I launched VIX and More some eight plus years ago, I have devoted one post to highlighting the top 25 most-read posts of each year. I do this in part for archival purposes: to see what is important to readers and how their interest in various issues changes over time. I also hope that these aggregations of most-read posts will serve as relatively easily accessible repositories of high-quality material for the benefit of new readers and long-term readers alike.

During 2014, the blog saw an extended hiatus for the first time in its history, largely due to events arising from the passing of my father. For this reason, I am limiting the number of top posts for the year to thirteen, largely because Song for My Father* ended the year in the #13 slot.

Looking ahead, volatility is back and so am I. I miss writing and I miss the interaction with readers. In the coming year I will significantly ramp up my activity on the blog and also in the comments section. I will also continue to write a weekly newsletter specializing in volatility (which just so happens to have a 14-day free trial), pen periodic guest columns for Barron’s and perhaps contribute to some other publications as well.  All this will be in addition to my primary role, which is that of an investment manager.

In 2014, some of the top stories were Ebola, Ukraine vs. Russia, crude oil, ISIS/ISIL, the Fed and the European Central Bank.  The posts below represent those that have been read by the highest number of unique readers during 2014. Farther down there are links to similar lists going back to 2008, along with several other “best of” type posts that I have flagged for archival purposes.

For the record, each year I also attach the hall of fame label to a handful of posts that I believe have particularly compelling and/or original content, regardless of readership. I was a tough grader last year, as I only added one new post to the HoF in 2014, but I already have an addition for 2015 and my goal is to continue to crank out Hall-of-Fame-worthy posts on a regular basis in 2015 – and even manage to do it without assistance provided by performance-enhancing drugs…

With an increase in posting on the blog, I also foresee a substantial uptick in my activity on Twitter, where @VIXandMore gives me a platform to contribute more in terms of time-sensitive news, short-term insights and other related subjects.

The thirteen most-read posts on VIX and More in 2014 were:

Related posts:

Disclosure(s): none

Sunday, January 26, 2014

Top Posts of 2013

Every year I tabulate the most-read posts in this space as a way to monitor the issues that are resonating with readers and also to see how these issues evolve over time. These most-read posts also serve as easily accessible repositories of high-quality material for the benefit of new readers and long-term readers alike.

The top themes from 2013 echo some top themes that resonated with readers from previous years, including continued interest in VIX spikes and SPX pullbacks, as well as the VIX ETPs, low volatility ETPs, the Fed, interest rates and various global flash points, such as emerging markets.

The posts below represent those that have been read by the highest number of unique readers during 2013. Farther down there are links to similar lists going back to 2008, along with several other “best of” type posts that I have flagged for archival purposes.

For the record, each year I also attach the hall of fame label to a handful of posts that I believe have particularly compelling and/or original content, regardless of readership. I find it interesting that ten posts from 2013 made it into the hall of fame – a record for any single year. Part of the reason for this is that while my total number of posts for 2013 was low, I favored quality and more in-depth analysis than pithy commentary, most of which I have migrated to my Twitter handle feed, @VIXandMore

The most-read posts on VIX and More in 2013 were:

Related posts:

Disclosure(s): none

Monday, June 17, 2013

The VIX and the Pre-FOMC + Post-FOMC Trades

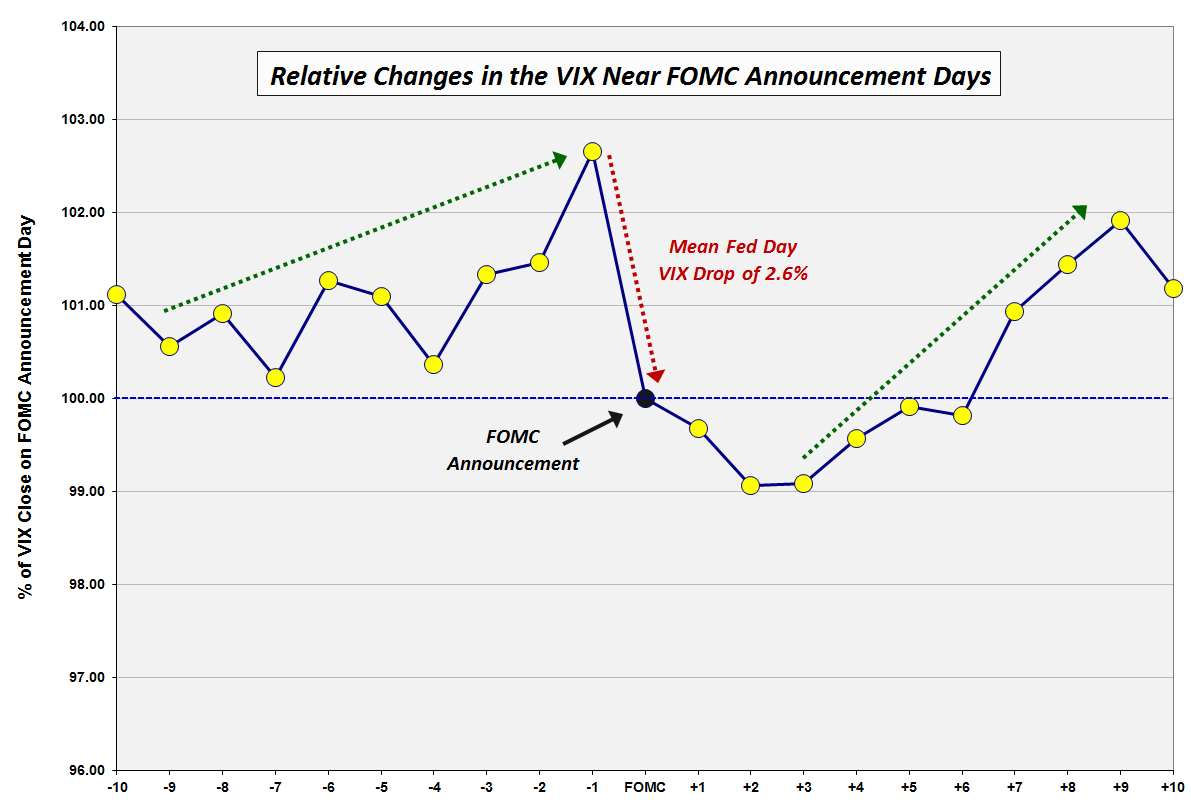
Back in December 2008, in VIX Trends Around FOMC Announcement Days, I posted a chart of the average movements in the VIX in the ten trading day leading up to and following “Fed Days,” otherwise known as days in which the Federal Open Market Committee (FOMC) makes its policy statement announcement. Several long-time readers who recall that chart – and an earlier incarnation from VIX Price Movement Around FOMC Meetings – have recently asked for an updated version. With all eyes on the Fed’s statement and Ben Bernanke’s press conference on Wednesday, this seems like a good time to revisit how the VIX moves in the days leading up to and following FOMC announcements.

In the chart below, I have normalized VIX data going back to 1990 to make it easy to compare the mean daily changes in the VIX in the ten trading days preceding FOMC policy statement announcements as well as ten trading days following those announcements. The quick takeaway is that the data from the last five years has been consistent with the data as of 2008. There are still three dominant features in this chart:

  1. a pre-FOMC VIX ramp in which the VIX tends to move up sharply in the three days leading up to the FOMC announcement and trend up more gradually 1-2 weeks in advance of the announcement
  2. a sharp decline in the VIX averaging about 2.6% on the day of the FOMC announcement, with a gradual decline in the VIX of another 1.0% or so in the two days following the announcement
  3. a sharp rebound in the VIX that starts three days after the FOMC announcement and persists until nine trading days after the announcement

Over the course of the past five years, the pre-announcement ramp in the VIX has been steeper during the three days prior to the announcement and more gradual in the week or so prior to that period. Also, recent history has seen the post-announcement decline in the VIX extending two additional days to now span four days following the announcement.

Of course there is no reason to expect that patterns which have persisted for the past 33 years to magically reappear for each FOMC announcement going forward, but I do believe that the historical pattern does say something about human nature, uncertainty and perceptions of risk.

It is worth noting that the biggest one-day jump in the VIX on a Fed day dates from February 4, 1994, when Federal Reserve Chairman Alan Greenspan surprised the markets by announcing a 0.25% increase in the federal funds rate, helping to lift the VIX 41.9% on that day. For comparison purposes, the next largest Fed day VIX increase was a 15.1% gain on March 15, 2011. While another VIX pop may be in the cards, history says there is a 72% chance the VIX will decline on Wednesday and that the decline should average about 2.6% or about 0.44 based on the current level of the VIX.

What is the trade here? While many will undoubtedly try to guess the direction of Wednesday’s move, the three other trades with a historical bias include:

  1. an increase in the VIX in advance of Wednesday’s announcement
  2. a continuation of any decline in the VIX from Thursday to Monday
  3. a new uptrend in the VIX beginning on Monday or Tuesday and running through the beginning of July.

[source(s): CBOE, Yahoo, VIX and More]

Related posts:

Disclosure(s): none

Monday, January 7, 2013

Investor Fears Pivot to U.S. Deficit and Debt Ceiling Following Cliff Deal

Just one week after Democrats and Republicans cobbled together a last-minute fiscal cliff deal, investors turned their focus to the next battleground in the fiscal crisis, tabbing the U.S. deficit and debt ceiling as their #1 concern in the VIX and More weekly fear poll. Fears associated with governments and politicians polled a distant second, while ongoing worries related to weak corporate earnings finished in third place, one day before Alcoa (AA) unofficially kicks of the Q4 earnings reporting season.

The two issues that dominated the fear poll during the last quarter seem to have receded from the consciousness of most investors. While the legacy of the fiscal cliff lives on in the debt ceiling discussions, the immediate threat has passed. Meanwhile, in spite of warnings from the likes of Angela Merkel, concerns related to the European sovereign debt crisis remain at low levels and continue to decline.

On the institutional front, one of the residual effects of the fiscal cliff is a persistent worry that the fiscal cliff is merely a symptom of a dysfunctional bi-partisan government with a newfound affection for brinksmanship. On the other hand, worries about excessive central bank intervention are falling, no doubt helped in that regard by the recent FOMC minutes from the December 11-12th meeting.

With the VIX posting a record one-week decline last week, it is reasonable to conclude that investor worries about the fiscal cliff were of a much higher magnitude than those related to the U.S. debt ceiling and deficit. In fact, there are some divergent opinions about the relationship between the declining VIX and the fiscal cliff deal. For more on this subject, check out the comments from Jared Woodard of Condor Options in The Market Is As Nervous as Ever About Austerity Fetishisms, in which Jared picks up on a theme from a recent note by Alec Phillips of Goldman Sachs (GS).

Once again, thanks to all who participated in this weekly poll.

Related posts:

Disclosure(s): none

Monday, December 10, 2012

Fear Poll Respondents Focus on Fiscal Cliff, Dismissive of European Financial Crisis

For the eighth week in a row, concerns about the U.S. fiscal cliff topped the VIX and More weekly fear poll. Fears related to excessive central bank intervention nudged out concerns related to government and politicians as the #2 issue, but perhaps the most interesting development is the how much the anxiety related to the European sovereign debt crisis continues to subside.

From a geographical perspective, U.S. and non-U.S. respondents had a relatively low divergence of opinion this week. That being said, whereas U.S. respondents cited the fiscal cliff as the top concern, non-U.S. respondents were most concerned about excessive central bank intervention in the economy. Perhaps part of the fallout from the fiscal cliff negotiations is that U.S. respondents see governments and politicians as much more likely to be the top threat to the stock market, by a margin of 5.6% over non-U.S. respondents.

Interestingly, both U.S. and non-U.S. respondents expressed much less concern about the euro zone problems, with only 4.9% of U.S. respondents citing euro zones as the #1 concern, while 5.9% of non-U.S. respondents put the euro zone issues at the top of the list.

With the FOMC meeting scheduled to wind up on Wednesday, the fiscal cliff talks inching closer to that last day on which legislation can be introduced in Congress for the year (December 18th, based upon a December 21st recess) and Alcoa scheduled to report Q4 earnings and unofficially kick of the next earnings reporting season on January 8th, there is the potential for quite a few things to hit the fan in the coming month.

In spite of all these threats looming just around the corner, the VIX remains subdued and is still in a position to reinforce the notion that December Is the Cruelest Month…for the VIX.

Once again, thanks to all who participated in this weekly poll.

Related posts:

Disclosure(s): none

Tuesday, July 10, 2012

Guest Columnist at The Striking Price for Barron’s: How to Trade Options Around Volatile Events

Once again I am happy to be able to pinch hit for Steve Sears and his The Striking Price column at Barron’s. In How to Trade Options Around Volatile Events, I expand on some of the thinking that I first laid out in 2008 in A Conceptual Framework for Volatility Events. Specifically, I discuss some of the trading opportunities associated with event volatility and tie that in to FOMC meetings, the European sovereign debt crisis and similar sources of volatility.

For the record, I generally try to accomplish three things when I write a column for Barron’s:

  1. tackle a subject (or two) that is timely and relates directly to current events
  2. focus more on concepts and ideas than a specific trading opportunity
  3. weave in some of my original research and analysis

Given all the is going on in the world and all the deadlines and key events that loom in the next six months, the subject of how to trade options around volatile events deserves much more discussion – and I will do what I can to fill that gap in the weeks and months ahead.

Related posts:

A full list of my Barron’s contributions:

Disclosure(s): none

Wednesday, June 10, 2009

Historical Volatility Continues to Plummet

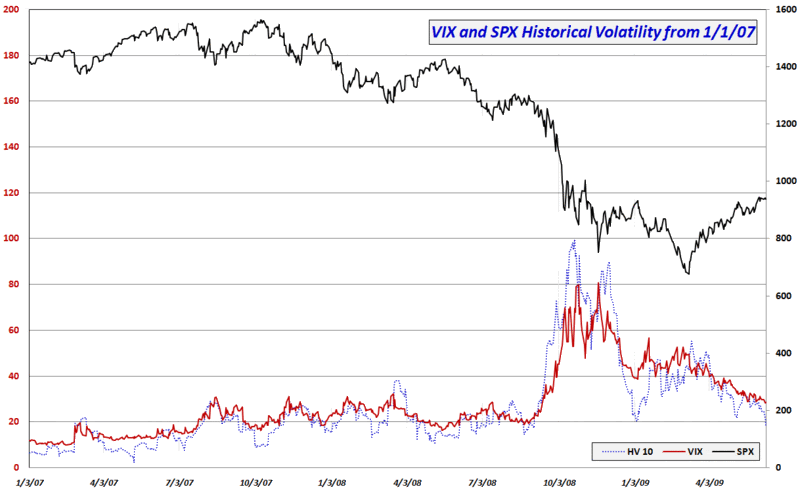
Further to this morning's pre-market post, Volatility in Context with VIX at Pose-Lehman Low, today’s 0.35% drop in the SPX means that it has now been four days since the S&P 500 index has moved more than 0.35%.

The range-bound trading is taking a heavy toll on historical volatility (HV), with today’s action pushing the 10 day HV in the SPX down from 21.54 to 18.10 – the lowest reading since September 3, 2008.

The graphic below attempts to put the current historical volatility levels into the context of the past 2 ½ years. Note that the current 10 day HV of 18.10 fits right in the middle of the range for this measure during 2007 (a year of very low volatility) and the pre-Lehman portion of 2008. In fact, given the recent historical record, I would be quite surprised to see 10 day HV fall any farther than the current level for at least another month or two.

Of course the VIX can continue to decline in the absence of falling volatility, but at some point historical volatility begins to provide some semblance of a floor below which the VIX is unlikely to remain.

On the other side of the coin, investors should also be aware that it has now been 26 sessions since the VIX was above the 35 level. If there is a catalyst (such retail sales numbers, housing data, industrial production statistics, Treasury auction results, the FOMC meeting in two weeks, etc.) that will change the volatility equation, then it is reasonable to look to 35 – not 40 or 50 – as the target for a VIX spike.

Finally, with volatility expectations shrinking almost on a daily basis, those who may be interested in speculative buying VIX out-of-the-money calls might find them a lot cheaper than anticipated – and perhaps a lot cheaper than they will be in another week or two.

[graphic: VIXandMore]

Tuesday, December 16, 2008

VIX Trends Around FOMC Announcement Days

I have recently received several requests to update research I posted in the first month of the blog (January 2007) under the title of VIX Price Movement Around FOMC Meetings.

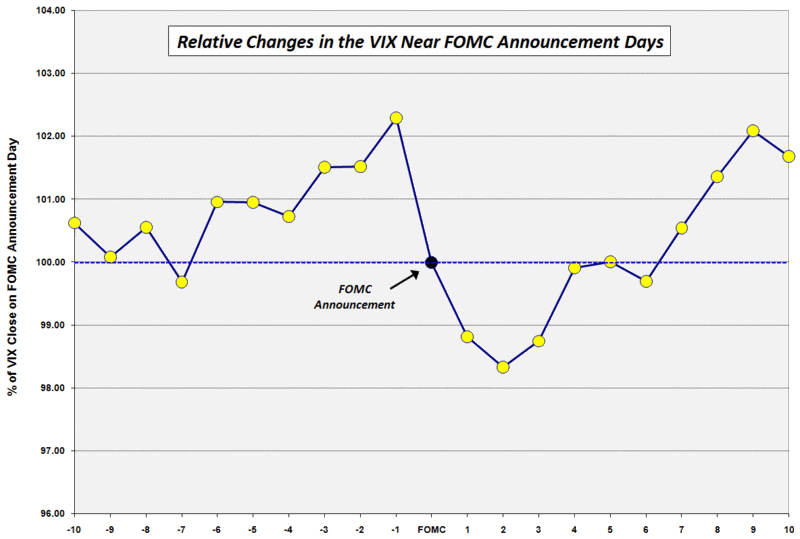
The general pattern identified almost two years ago is still intact. In the chart below, I have aggregated the data for 19 years of VIX history covering a period spanning ten days before to ten days after some 150+ FOMC meetings. With the closing VIX price on the Fed days indicated by a black dot, it is easy to identify a pattern of volatility increasing in the week prior to the announcement, then dropping dramatically for three days following the announcement, and slowly building back to pre announcement levels thereafter.

Not surprisingly, one of the most predictable aspects of the VIX is that it has a tendency to increase dramatically on the day before the announcement as anxiety builds about possible changes in Fed policy, then drop by about 2.3% on the day of the announcement as the markets discover that the worst fears were not realized and/or the Fed’s actions and statements had been largely discounted in advance.

For a more detailed interpretation, check out my commentary in the January 2007 post.

[source: VIX and More]

Tuesday, September 18, 2007

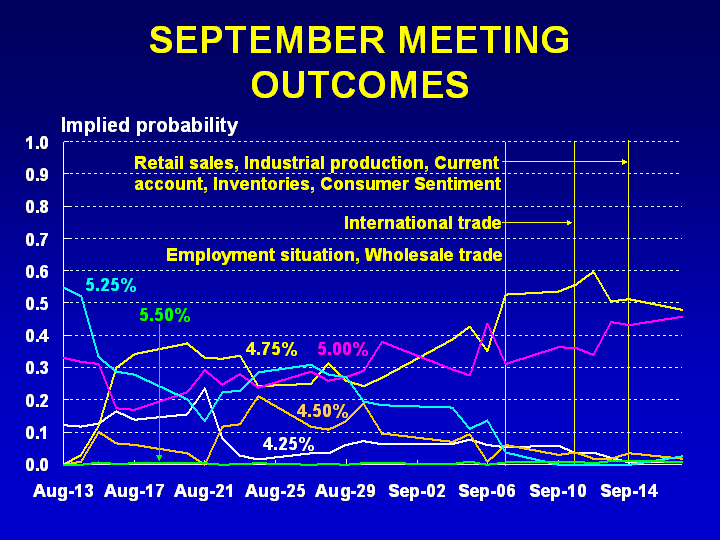
Rate Cut Projections

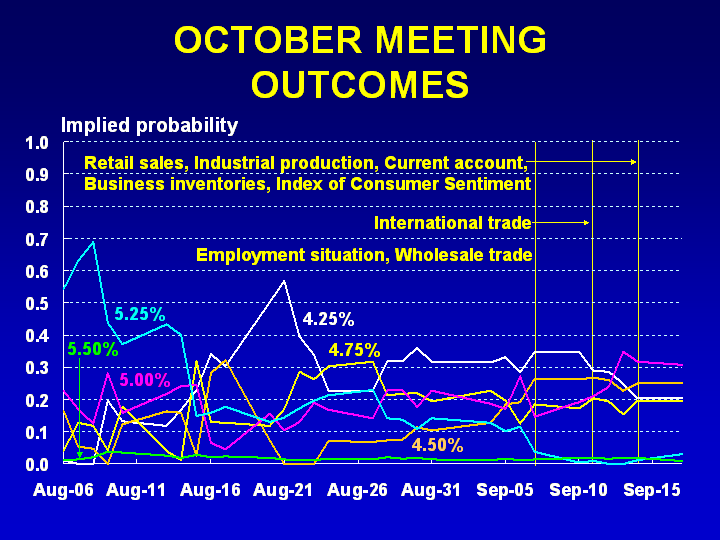
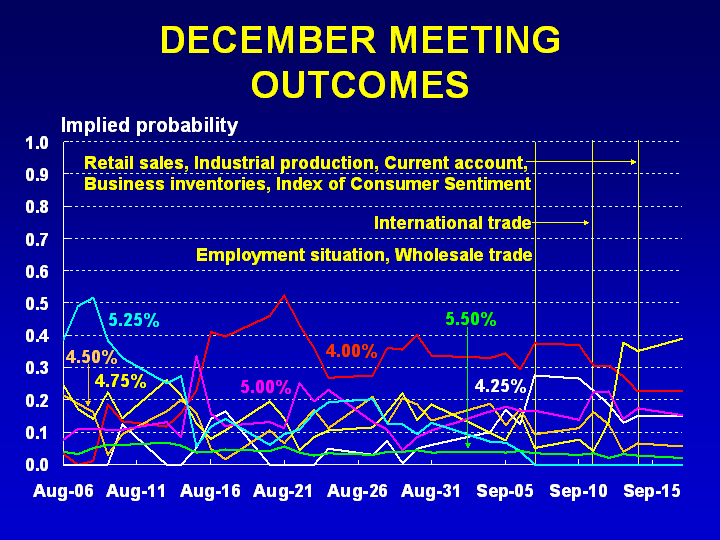
Charts courtesy of the Cleveland Fed's web site:


Wednesday, September 12, 2007

The VIX and the Fed

Since nobody was reading this blog when I first posted about the VIX and FOMC meetings, I thought I might use next week’s highly anticipated FOMC meeting as an excuse to flag some research I published earlier in the year.
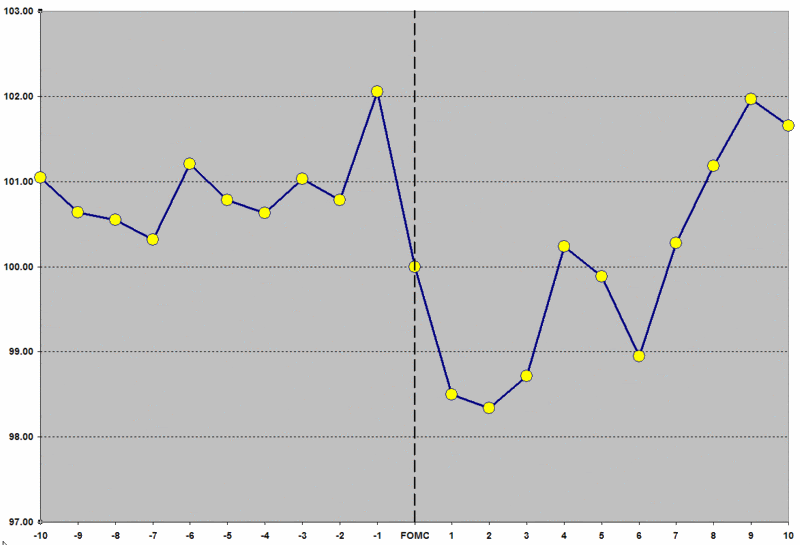
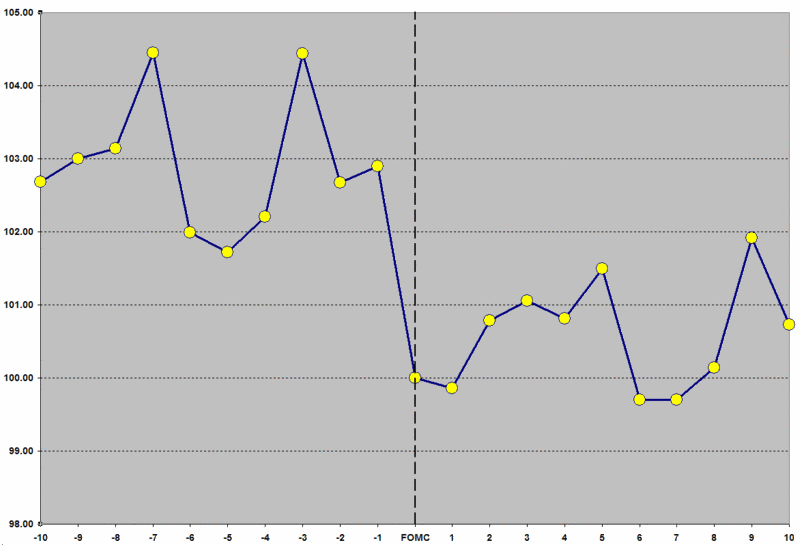
Perhaps the most important piece of information on the VIX and the Fed is a study I have placed in the Archive Highlights section of the blog with the title “VIX Price Movement Around FOMC Meetings.” If you follow the link, you can see why the odds favor a substantial volatility contraction on Tuesday, when the results of the meeting are announced, as well as another smaller volatility contraction on Wednesday, after the information has been digested overnight.

While I am on the subject of the Fed and Archive Highlights, I would be remiss in not pointing out what I consider to be the best set of links on the Fed available on the internet, which I have archived in “Fed Links.”

One other blog link is worth flagging here, the rather innocuous sounding “Options Expiration Calendar,” which resides in the VIX and Sentiment Links section in the upper right hand corner. The reason I mention this link is to remind all interested parties that one of the idiosyncrasies of VIX options is that they do not expire on the third Friday of every month, like equity, index and many other options. Instead, 9 months of the year VIX options expire on the Wednesday after the third Friday of the month; 3 months of the year they expire on the Wednesday before the third Friday of the month – right in the middle of options expiration week. As you can see in the calendar linked above, this early VIX options expiration pattern happens at the end of each quarter in March, June, September and December. This means that VIX options expire the day after next week’s big FOMC meeting, with a special opening quotation (more on this another time.) Even more important, the last day for trading these VIX options is the day before they expire. So anyone holding VIX September options will have exactly 1:45 following the Fed’s announcement to close out their positions. Given the high expectations going into the Fed meeting, it will be very interesting to watch the VIX action – as well as the action on the VIX September options.

So while Tuesday will be a particularly busy day for me, remember that you don’t have to play unless the odds are in your favor. When in doubt, get neutral and watch the action for free from the sidelines.

Wednesday, March 21, 2007

Fed Links

In addition to the links below, I intend to have an in-depth analysis of the VIX on Fed Days for the next FOMC meeting on May 9th.

General Fed links:


If you want links to speeches from any of the FOMC members, unfortunately it gets a little messy, as you have to go to the individual site for each regional Fed branch:
(FWIW, the slow market pre-announcement period is a good time to get caught up on your reading...)

Now for the good stuff:

Monday, January 29, 2007

More on the VIX Fizz on Fed Days

We have already established that the VIX tends to fizzle on Fed Days, but how often does it pop 10% following an announcement?

Not very often, it turns out. In fact, you have to go back 104 Fed meetings ago to February 4, 1994 (the same 1994 that Doug Kass was talking about as a 'bear template') to find the most recent 10% Fed Day VIX spike upward -- and that is the only 10% Fed Day jump since the VIX was officially rolled out in 1993.

It should come as no surprise that 1 in 104 is almost in the black swan category in terms of the VIX. I noted previously that almost 1 in 3 weeks sees a VIX move of 10% in one direction or the other, so don't expect to be surprised on Wednesday and think long and hard about paying a premium to get a front row seat to see the next black swan.

Sunday, January 28, 2007

VIX Price Movement Around FOMC Meetings

In VIX Performance During the Options Expirations Cycle, we fired a shot across the bow of the options expiration volatility myth. Now we turn our attention to volatility associated with FOMC meetings.

I looked at end of day price changes in the VIX covering a period of 10 days prior to the FOMC announcement to 10 days following the announcement, from 1990 to the present . I normalized the EOD VIX on announcement day at 100 to make for a more meaningful scale and the following picture jumped out at me:


The graphic tells the story rather succinctly and it suggests that it is wise to be short volatility on the day before the FOMC announce and to be long volatility the day after the announcement, with the expectation of a volatility mini-crush of sorts, on the order of about 3.5% -- with half of that move coming on announcement day and the other half of the move coming the day after the announcement.

It turns out that Peter Carr and Liuren Wu published some similar observations in May 2004, so I checked to see if the publication of that information resulted in a change in the trend. To my surprise, the trend has remained relatively intact in the subsequent 21 data points over the past 2 ½ years:


Looking at the more recent data, the mini-crush has been closer to 3.0% since May 2004, but two key differences should be noted:

  1. Over 90% of the mini-crush has happened on announcement day, with very little movement on the subsequent day

  2. Volatility has no longer reverted to pre-announcement levels in the week or two following the announcement, rather it has remained lower post-announcement in the past 2 ½ years

Of course, there is considerable risk in jumping to conclusions that the 21 most recent data points are defining a new context for FOMC announcement volatility, but that possibility bears watching.

DISCLAIMER: "VIX®" is a trademark of Chicago Board Options Exchange, Incorporated. Chicago Board Options Exchange, Incorporated is not affiliated with this website or this website's owner's or operators. CBOE assumes no responsibility for the accuracy or completeness or any other aspect of any content posted on this website by its operator or any third party. All content on this site is provided for informational and entertainment purposes only and is not intended as advice to buy or sell any securities. Stocks are difficult to trade; options are even harder. When it comes to VIX derivatives, don't fall into the trap of thinking that just because you can ride a horse, you can ride an alligator. Please do your own homework and accept full responsibility for any investment decisions you make. No content on this site can be used for commercial purposes without the prior written permission of the author. Copyright © 2007-2023 Bill Luby. All rights reserved.
 
Web Analytics