Showing posts with label biotech. Show all posts

Sunday, January 25, 2015

The Year in VIX and Volatility (2014)

This is the seventh year in a row I have offered a retrospective look at the year in VIX and Volatility, which is my attempt to cram some of the highlights of the year in volatility onto one eye chart graphic with a (somewhat) manageable number of annotations.

In aggregate, 2014 was a very quiet year for the VIX, with a mean close of just 14.19 for the year, which is the lowest the VIX has been since 2006 and third lowest since 1995. On the other hand, as I recently documented, VIX spikes were common last year, with 2014 registering the third highest number of 20% VIX spikes since the beginning of VIX data, in 1990. In short, the VIX was susceptible to large spikes, but these were typically followed by strong mean-reverting declines. For example, the peak VIX of 31.06 on October 15 was the highest VIX reading since 2011, yet just six weeks later the VIX was back in the 11s.

When asked in October what they perceived as the biggest threat to stocks, respondents to the VIX and More fear poll pointed to the end of quantitative easing and the removal of the Fed safety net as their top concern, with Ebola narrowly edging out the much more nebulous “market technical factors” for the second slot. As best as I am able to determine, it was the panic associated with fears of an Ebola epidemic that took an already elevated VIX and pushed it up into the 30s.

At various times during the year, Ukraine/Russia, crude oil, ISIS/ISIL, Israel/Gaza, the Fed and the European Central Bank all managed to increase anxiety and perceptions of risk among investors. Also, the narrow miss in the vote for Scottish independence created turmoil in the United Kingdom and across the euro zone, but managed to avoid morphing into another nationalist crisis. Early in the year, there was a currency crisis in emerging markets that was triggered by (unfounded, in retrospect) concerns about higher interest rates in the U.S. Throughout the year there were concerns about valuations and excesses momentum trading in the likes of biotechnology, social media, internet and solar stocks. To some extent, these concerns peaked in April (see The Correction as Seen in the ETP Landscape for additional details), only to return periodically throughout the balance of the year.

The Year in VIX and Volatility 2014

[source(s): StockCharts.com, VIX and More]

Last year at this time, the prevailing worries were focused on whether or not Fed Chair Janet Yellen was leaning toward a more hawkish stance, the inevitable march to higher interest rates in the U.S., the weakening of emerging markets currencies and the potential fallout from the Fed’s tapering of bond purchases. In retrospect, investors were largely worrying about the wrong things.

The first few weeks of 2015 have seen Greece, Saudi Arabia and Ukraine back in the spotlight, with the Swiss National Bank and European Central Bank dominating news on the central banking front. If the past is any guide, the big issue for 2015 has yet to rear its ugly head, whether it turns out to be a gray, charcoal or black swan.

Related posts:

Disclosure(s): none

Tuesday, April 15, 2014

The Correction As Seen in the ETP Landscape

Since stocks bottomed in March 2009, I have periodically been publishing an SPX pullback table and occasionally a plot of all those pullbacks and their duration. The recent selloff in stocks, however, has been anything but an SPX pullback. I toyed with the idea of presenting comparable data for the NASDAQ Composite or NASDAQ-100 Index (NDX), but here again, the selling has been disproportionate in some areas of the NASDAQ universe, even though it has been hit harder than the SPX.

This time around I have opted instead for a chart that shows the peak-to-trough drawdown across the equity ETP universe, focusing on sector groups that I believe are among the most important to watch.

ETP Landscape 2014 DDs 041514

[source(s): Yahoo, VIX and More]

The data above cover only 2014 and indicate the maximum drawdown since the 2014 peak. While many of these maximum drawdowns are from earlier today, there are quite a few instances in which the maximum drawdown was established earlier in the year.

Note that while the NASDAQ gets most of the attention, it is the small caps (IWM) that have suffered the most among the major market index ETPs.

Not surprisingly, biotechnology (IBB), social media (SOCL) and Russia (RSX) have seen the largest declines, but among cyclicals, defensive stocks and European country ETPs, there is very little to choose from.

Finally, just for fun I have added four alternative ETPs with an equity flavor (SPLV, PBP, CWB and PFF) to show how low volatility, covered call, convertible bond and preferred stock ETPs have fared.

Related posts:

Disclosure(s): none

Thursday, July 15, 2010

VVUS as an Option Pricing Case Study

Trading in Vivus (VVUS) is halted this morning, as the biotechnology company’s new weight-loss pill, Qnexa, is being reviewed by a panel of experts at the FDA.

In many respects biotechnology stocks – particularly those which do not yet have products that are commercially available – are options dressed up as stocks. More than other sectors, a biotechnology stock is a company that is a portfolio of options on all the projects (drugs) that are in the research and development stage, plus commercial products which can be valued with more traditional discounted cash flow models and the like.

Options on biotech stocks without any commercial products are therefore a lot like options on options. For those biotechs where the value of the pipeline is skewed largely in the direction of a single drug, the option on the option of a single drug can result in extreme uncertainty and implied volatility, as highlighted in VVUS Implied Volatility Tops 700.

With the FDA panel decision due out today, investors have been valuing VVUS stock on the basis of a probability-weighted set of outcomes that could easily double or halve the stock price when the stock opens for trading again.

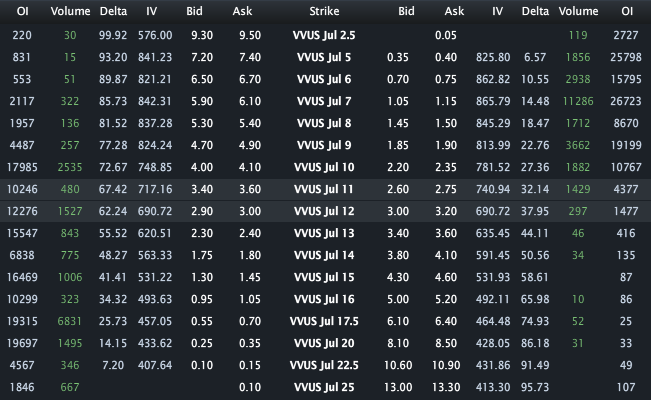
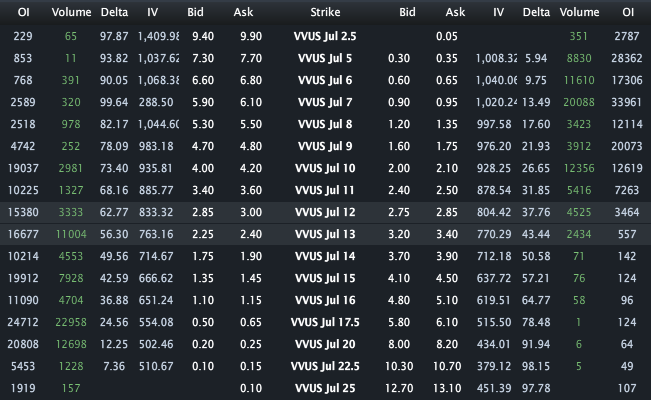
As the time of the FDA panel decision has approached, it has been interesting to watch the price of VVUS options. For the most part, the prospects for the company and the probabilities associated with the FDA panel decision have changed very little. The charts below show there was very little change in the price of VVUS options from Tuesday at 10:34 a.m. ET, when VVUS was trading at 11.93 (top graphic) to the end of yesterday’s session, when VVUS closed at 12.11 (bottom graphic). Notice, however, that while the price of the various options held steady, the implied volatility spiked even higher in order to support the same options values as time decayed and the July options expiration neared. A good example is the July 11 calls, which showed a bid-ask of 3.40 – 3.60 in each instance, yet the implied volatility had to rise from 717 to 885 in order to maintain the same option price almost two full sessions later.

With VVUS, we have an interesting glimpse of the options pricing model at work. With the underlying, option price, strike price and interest rate unchanged, what we see with VVUS is almost a pure interplay between implied volatility and time. Assuming VVUS opens up for trading on expiration day tomorrow, I will be watching the collapsing volatility and gyrating stock price as the pricing model transitions back to a more common interplay of implied volatility vs. the price of the underlying.

For more on related subjects, readers are encouraged to check out:


VVUS options on Tuesday, 7/13/10 at 10:34 a.m. ET, with the underlying at 11.90


VVUS options after market close on Wednesday, 7/14/10, with the underlying at 12.11


[source: Livevol Pro]

Disclosure(s): long VVUS at time of writing; Livevol is an advertiser on VIX and More

Friday, September 18, 2009

Comfort Zones, Focus and Thinking Like a Biotech Firm

In Wednesday’s post, Kafka, Surrealism and Trading, I talked about the importance of getting out of one’s comfort zone in order to enhance trading. One reader expressed concern that that pushing the envelope too far and straying from one’s comfort zone was an excellent way to learn some expensive lessons and potentially an approach that invites disaster.

The reader makes some excellent points, so let me expand upon and clarify my thinking.

Consider a biotechnology company as a metaphor for trading and specifically for trading strategy development. A biotechnology firm manages a pipeline of drugs in development and in many cases, also has drugs on the market that are generating revenue. Think of the drugs in the pipeline as analogous to investment ideas that the trader is still incubating, testing and deciding whether or not they have sufficient potential to warrant implementing with trading capital.

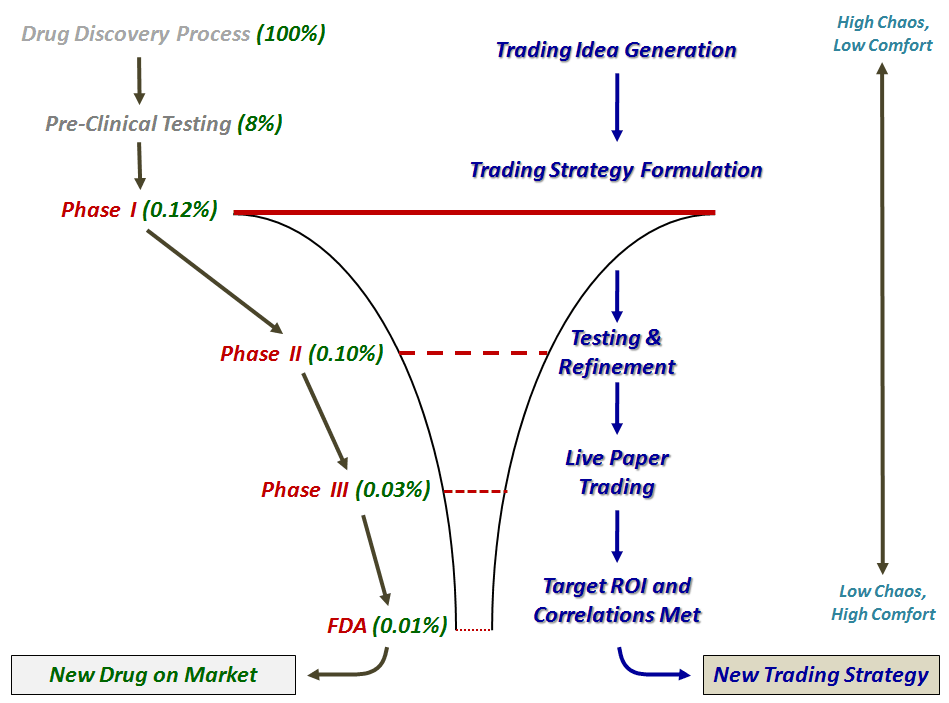
For drugs in the pipeline, there are various stages of development before the drugs are tested for efficacy and side effects. As drugs progress through the pipeline, they go through internal gated approval processes known formally as Phase 1, Phase 2 and Phase 3 and eventually through an FDA final approval process that determines whether the drug can be sold to the public. Only a small percentage (approximately 8%) of potential new drug ideas make into pre-clinical trials and less than 1% are deemed sufficient to warrant the investment associated with Phase 1 trials. As drugs encounter the gated approval process at the end of each trial phase, the number of high potential candidates is continually winnowed down, as issues related to efficacy or side effects are subjected to rigorous statistical analysis. As these drugs advance through the pipeline, the financial investment increases substantially. Ultimately, only about 1 in 10,000 of the original drugs involved in the drug discovery process makes it all the way through to FDA approval and ends up on the market. On average, the process takes about ten years.

Investors should look at their investment ideas and strategies as a pipeline management process too. There is limited capital available and only the best strategies should be funded. At the beginning of the pipeline, investors should focus the most attention on getting out of their comfort zone, formulating wild new trading ideas and translating these into actionable strategies. This is the best time to get out of one’s comfort zone and embrace some chaos. As the ideas then progress through some sort of internal approval process, then focus become more important. Is the idea robust? Can the idea be translated into effective strategies? Is there enough liquidity to implement these strategies? What will the slippage costs be? What do the initial backtesting results show in terms of potential? Etc.

As new ideas progress through an internal approval process, the trader should move from an area of discomfort to an area of extreme comfort. By the time a trading strategy is ready to be deployed, the trader’s mind set should have evolved from one of high chaos and low comfort to low/no chaos and high comfort. A corollary of the trading idea development process, which I have sketched out in the graphic below, is that the more one is able to get out of their comfort zone at the beginning of the trading idea pipeline, the better the trading results and the more likely there will be uncorrelated strategies when the chaos of idea generation is translated into focused strategies.

For more on trading strategy development, four excellent blogs to follow are:

Thursday, July 31, 2008

Biotech Breakout Confirmed

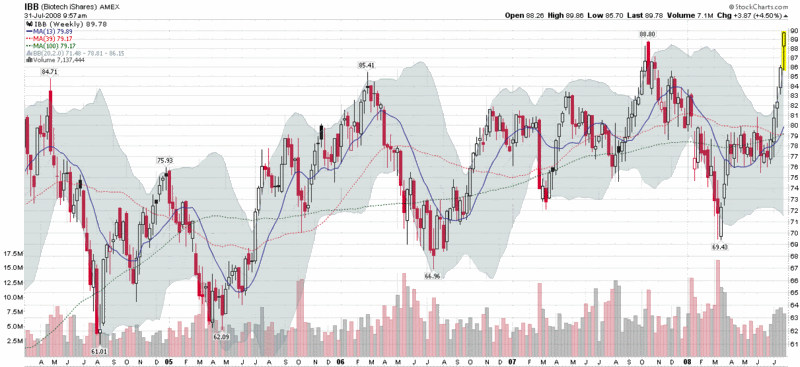
Further to my Biotech on a Tear post earlier this week, today’s action confirms that biotechnology stocks are officially breaking out. The chart below is a weekly chart of IBB, the most active of the biotechnology ETFs. It shows the ferocity of the biotech move over the course of the past month, even in the face of recent disappointing news on the Alzheimer’s front that battered Elan (ELN) and Wyeth (WYE).

Factoring in today’s 3% gain, IBB is set to close at a level not seen since the end of 2001. Note also that the candlestick patterns for the previous highs made in 2004, 2006, and 2007 all show a significant reversal pattern during the week in which those highs were made. With one more day in the week and a large buffer, the current chart pattern is likely to print a bullish pattern for the full week, in addition to the new high.

If you want to see what is hot in the biotech world, the sortable biomedical sector list at Barchart.com is a good place to start.

Tuesday, July 29, 2008

Biotech on a Tear

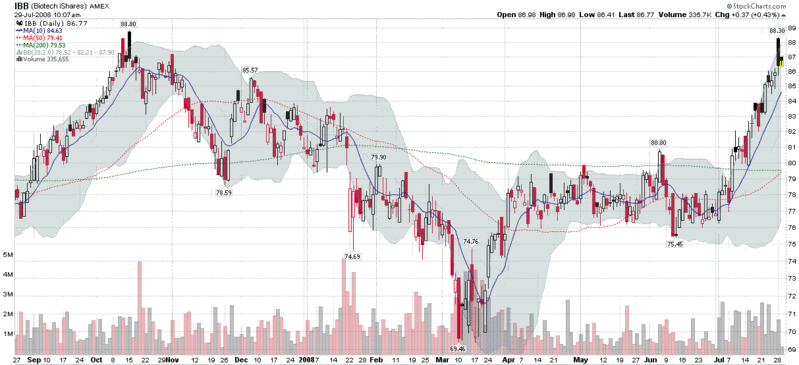
While most sectors have been faltering for the past month or two, biotechnology has been an exceptional performer, with the top biotech ETF, IBB, now more than 15% above its June low, as the chart below shows.

I last profiled biotech on May 1st in Time for Biotech to Turn Around? In retrospect, May and June were excellent months to get long biotech, even as the broad markets headed south.

Of IBBs top ten holdings, five of the ten are currently at or just below their 52 week highs, including:

  • Amgen (AMGN) – making another new 52 week high today
  • Illumina (ILMN) – made a new 52 week high yesterday
  • Celgene (CELG) – just 1.6% below its 52 week high
  • Gilead Sciences (GILD) – 5.7% below its 52 week high, but up about 40% for the year
  • Genzyme (GENZ) – 7.1% below the 52 week high, set back in January

Of course, there are many more success stories among some of the smaller cap biotechnology companies. So while the markets drift sideways and we wait to see if traditional technology stocks can provide leadership, this might be a good time to stock up on one of the few strong sectors: biotechnology.

Thursday, May 1, 2008

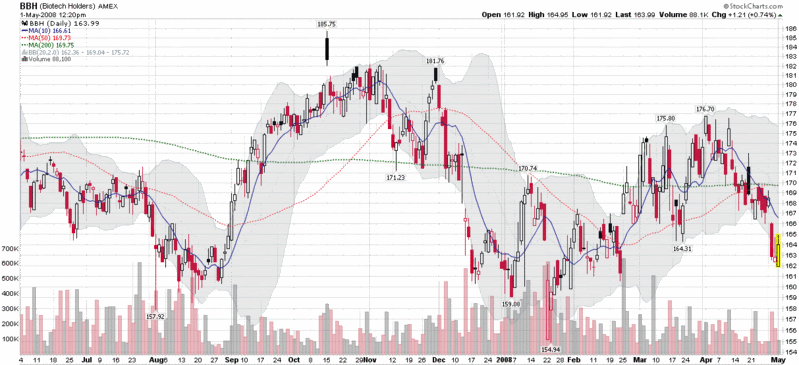
Time for Biotech to Turn Around?

I have been experimenting with a new volatility-centric sector rotation model that I may start talking about in more detail in this space in the coming weeks.

I mention this because the system generated a buy signal in BBH, the HOLDRS biotechnology ETF. While the system does not require a confirmation signal from today’s trading, BBH is trading up with the broader markets today, albeit with a smaller percentage rise. The chart below shows that biotech actually bottomed in January and has not participated in the rally off of the March lows. Generally a healthy biotech sector is an indication of bullish speculative activity. As such, this is one of my ‘indicator species’ charts to watch.

[Note to readers: I have heretofore avoided any disclosure statements when writing about stocks and ETFs. As my content is currently being picked up by Seeking Alpha and other aggregator sites, I will now make it a practice of disclosing positions in any securities mentioned in my posts. If there is no disclosure, this means I do not have a position in any of the securities I reference, as is the case with BBH today.]

Wednesday, January 2, 2008

Sector Clues in First Hour of 2008?

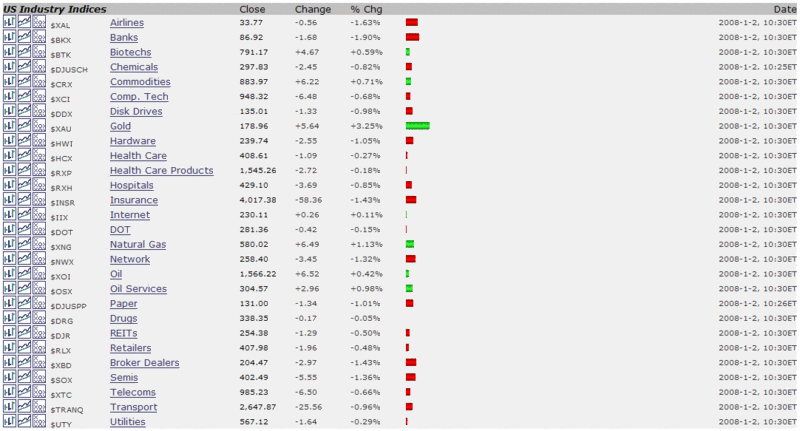
It’s never too early to try to discern what some of the new investing themes for 2008 might be, which is why I have included the StockCharts.com sector snapshot for the first hour of trading.

Given the low ISM numbers this morning, I am not surprised to see weakness across the equity spectrum. A couple of commodity sectors – gold and natural gas among them – are continuing their strong end of 2007 momentum into the beginning of the new year. One pocket of bullishness in the first hour that surprised me and is worth watching going forward is biotech.

On the downside, banks continue to get hammered, while REITs are currently in the middle of the pack.

DISCLAIMER: "VIX®" is a trademark of Chicago Board Options Exchange, Incorporated. Chicago Board Options Exchange, Incorporated is not affiliated with this website or this website's owner's or operators. CBOE assumes no responsibility for the accuracy or completeness or any other aspect of any content posted on this website by its operator or any third party. All content on this site is provided for informational and entertainment purposes only and is not intended as advice to buy or sell any securities. Stocks are difficult to trade; options are even harder. When it comes to VIX derivatives, don't fall into the trap of thinking that just because you can ride a horse, you can ride an alligator. Please do your own homework and accept full responsibility for any investment decisions you make. No content on this site can be used for commercial purposes without the prior written permission of the author. Copyright © 2007-2023 Bill Luby. All rights reserved.
 
Web Analytics