Showing posts with label trading strategies. Show all posts

Tuesday, December 29, 2009

Some Blogroll Highlights

As the year winds down, many traders and bloggers have put things on autopilot. While this is understandable, on my blogroll I noticed several important exceptions to this rule. Four blogs – three of which were launched in 2009 – have consistently hit high notes during the year and just happen to do so again during this slow period.

Rob Hanna at Quantifiable Edges is the multi-year veteran of the group. For those who may not be familiar with Rob’s work, he has compiled Quantifiable Edges Greatest Hits of 2009. This monthly retrospective may be the perfect introduction to a blog that is an excellent resource for those attempting to make the jump from a stock picker to a master of indicators and strategies.

Two other quantitatively-oriented strategies and systems guys just happened to be out with fine complementary pieces today. Like Rob, Frank at Trading the Odds can be counted on for thorough research and analysis covering a wide variety of strategies, which is always captured in a compelling and comprehensive manner. A former frequent commenter at VIX and More, Frank decided to set up his own electronic canvas earlier this year to have a more organized platform to share his thinking – and we are all better off for it. Today’s How to Make a Million (%) Trading the SPYDER – Part One is a fine example of Frank’s approach, leaving the reader with substantial food for thought and the promise of some excellent courses still to come.

In looking at David Varadi’s CSS Analytics blog, I was stunned to see that the blog is less than a half a year old. With all the high quality content that David has managed to shoehorn into just a few months, I’m sure my oversight can be forgiven. If this sounds like hyperbole, check for yourself. Start with today’s Relative Strength 101 and keep reading back in time until you lose interest. Warning: July comes up faster than you think…

Last but certainly not least is Tyler Craig’s options-oriented Tyler’s Trading. Today Tyler assembled a Blast from the Past which captures his top ten posts of the year. For the beginning to intermediate options trader, these articles combine important topics, excellent graphics, and facile prose.

Apart from coming up with something interesting to say on a regular basis, my biggest challenge here is undoubtedly maintaining an up-to-date, high quality blogroll that incorporates a wide variety of interests and perspectives from a mix of popular and semi-obscure bloggers. There are few things as invigorating, however, as discovering a fresh new voice. Let’s hope 2010 proves to be as fruitful in this regard as 2009 was.

Disclosure: Quantifiable Edges and the VIX and More Subscriber Newsletter are available as part of a bundle (with ETF Rewind) in Blogger Triple Play
Wednesday, December 23, 2009

Some Approaches to Trading ETFs

Two days ago in ETFs Increasingly Dominate Trading, I mentioned that this blog will devote more attention to ETFs in the coming year. I have also decided that after three years of dancing around the subject, I will also be a little more explicit in talking about different strategic approaches to trading as well as specific strategies.

Yesterday, while I was thinking about where these two new focal points intersect, I noticed a timely piece from CXO Advisory Group with the title of Simple Sector ETF Momentum Strategy Performance. The article, which looks at three different sector SPDR momentum strategies, ultimately concludes that “simple sector ETF momentum strategies have generally outperformed the broad stock market over the past decade for reasonably low trading frictions.” As someone who actively trades sector rotation strategies, I can’t say I was surprised by the results, but I thought the analysis and charts made for excellent reading – and are certainly worth a click through.

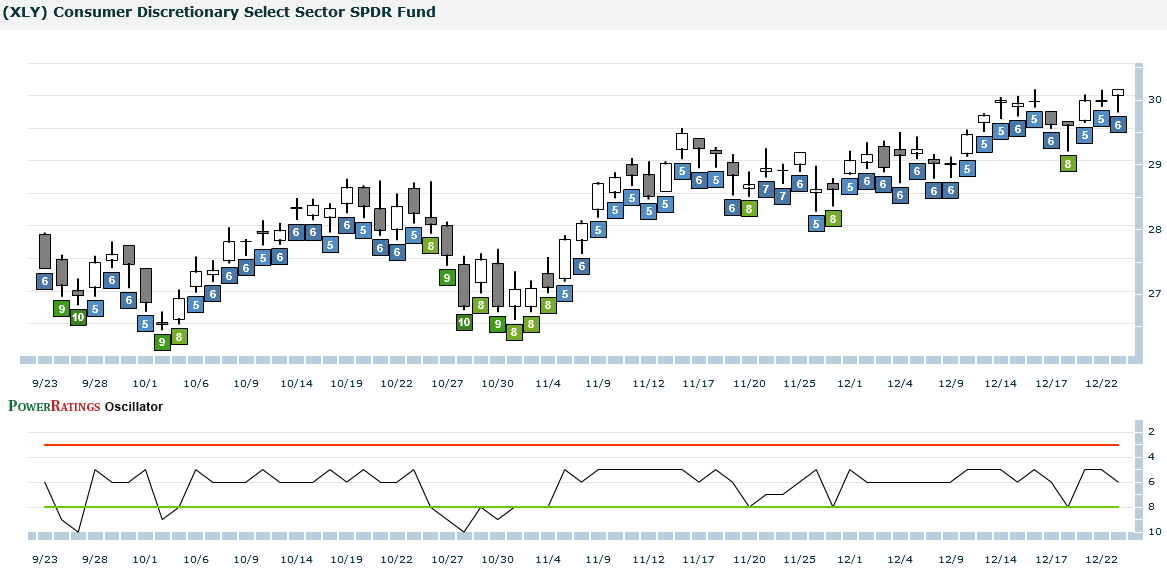
Speaking of sector and geography ETFs, I was also recently examining some of the work that TradingMarkets.com has done with ETFs in the context of their ETF PowerRatings. Anyone familiar with the work of Larry Connors will see how some similar themes from previous publications have been adapted to the ETF world. Based on some introductory materials and a review of charts such as the XLY chart below, it appears as if the ratings give the highest marks to ETFs that have shown intermediate-term trend strength, followed by a recent pullback. In other words, the ratings make it easy to get long up trends or short downtrends after a pullback makes for high probability entry signals. Frankly, this is the type of strategic approach that I have had a lot of success with and it appears that the ETF PowerRatings implementation is a similar application to some of my thinking about ETFs.

If the TradingMarkets approach appeals to the investor who is looking for someone else to do all the analysis and generate entry and exit signals, ETF Rewind is at the other end of the spectrum. In ETF Rewind Pro, Jeff Pietsch has built an Excel-based set of data and analytics that is ideal for the ideal for the investor who likes to do their own analysis and roll their own strategies, but needs a platform on which to make it all happen. Earlier this year, in Pairs Trading with ROB, I talked about some of the pairs trading applications that ETF Rewind can be used for. I failed to mention that ETF Rewind also comes with modules that generate both long and short weekly trend trading ideas, daily countertrend trading ideas and day trading candidates as well. Of course, most investors will also want to avail themselves of the almost encyclopedic collection of data for almost 200 ETFs and use the data and tools to develop their own strategies.

I should also note that I have a subscriber service which I rarely discuss here that utilizes a volatility-based ETF trading approach that I call EVALS (ETF Volatility Analysis Long/Short.) EVALS is unusual in that it is a trading approach which draws upon volatility-based indicators to trigger entries and exits. For more information, try VIX and More EVALS or check out the EVALS blog.

For more on related subjects, readers are encouraged to check out:

[graphic: ETF PowerRatings and TradingMarkets.com]

Disclosure: ETF Rewind and the VIX and More Subscriber Newsletter are available as part of a bundle (with Quantifiable Edges) in Blogger Triple Play

Friday, September 18, 2009

Comfort Zones, Focus and Thinking Like a Biotech Firm

In Wednesday’s post, Kafka, Surrealism and Trading, I talked about the importance of getting out of one’s comfort zone in order to enhance trading. One reader expressed concern that that pushing the envelope too far and straying from one’s comfort zone was an excellent way to learn some expensive lessons and potentially an approach that invites disaster.

The reader makes some excellent points, so let me expand upon and clarify my thinking.

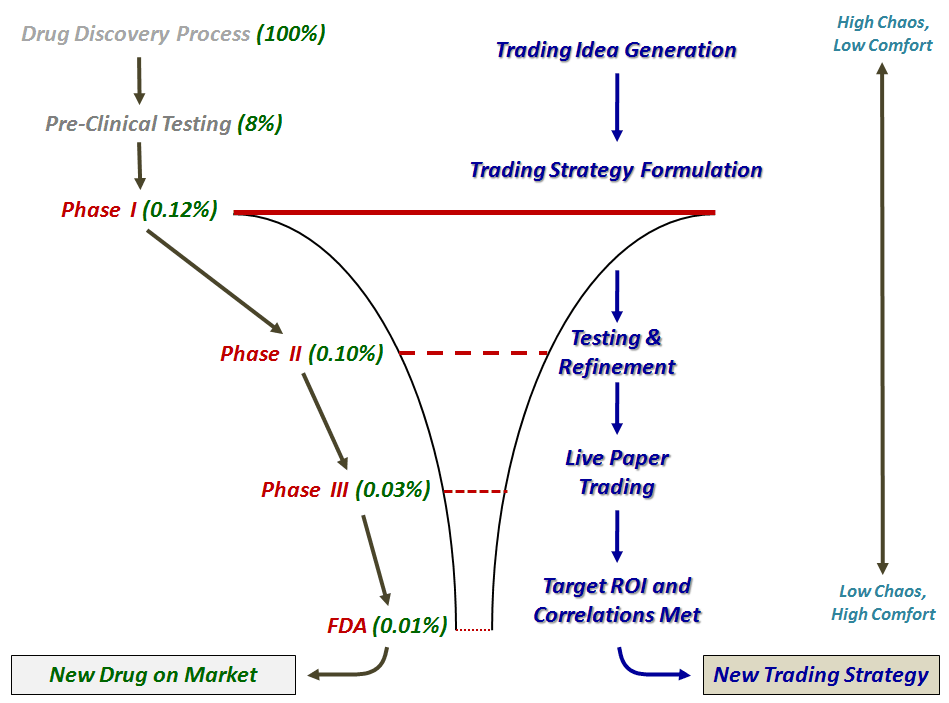
Consider a biotechnology company as a metaphor for trading and specifically for trading strategy development. A biotechnology firm manages a pipeline of drugs in development and in many cases, also has drugs on the market that are generating revenue. Think of the drugs in the pipeline as analogous to investment ideas that the trader is still incubating, testing and deciding whether or not they have sufficient potential to warrant implementing with trading capital.

For drugs in the pipeline, there are various stages of development before the drugs are tested for efficacy and side effects. As drugs progress through the pipeline, they go through internal gated approval processes known formally as Phase 1, Phase 2 and Phase 3 and eventually through an FDA final approval process that determines whether the drug can be sold to the public. Only a small percentage (approximately 8%) of potential new drug ideas make into pre-clinical trials and less than 1% are deemed sufficient to warrant the investment associated with Phase 1 trials. As drugs encounter the gated approval process at the end of each trial phase, the number of high potential candidates is continually winnowed down, as issues related to efficacy or side effects are subjected to rigorous statistical analysis. As these drugs advance through the pipeline, the financial investment increases substantially. Ultimately, only about 1 in 10,000 of the original drugs involved in the drug discovery process makes it all the way through to FDA approval and ends up on the market. On average, the process takes about ten years.

Investors should look at their investment ideas and strategies as a pipeline management process too. There is limited capital available and only the best strategies should be funded. At the beginning of the pipeline, investors should focus the most attention on getting out of their comfort zone, formulating wild new trading ideas and translating these into actionable strategies. This is the best time to get out of one’s comfort zone and embrace some chaos. As the ideas then progress through some sort of internal approval process, then focus become more important. Is the idea robust? Can the idea be translated into effective strategies? Is there enough liquidity to implement these strategies? What will the slippage costs be? What do the initial backtesting results show in terms of potential? Etc.

As new ideas progress through an internal approval process, the trader should move from an area of discomfort to an area of extreme comfort. By the time a trading strategy is ready to be deployed, the trader’s mind set should have evolved from one of high chaos and low comfort to low/no chaos and high comfort. A corollary of the trading idea development process, which I have sketched out in the graphic below, is that the more one is able to get out of their comfort zone at the beginning of the trading idea pipeline, the better the trading results and the more likely there will be uncorrelated strategies when the chaos of idea generation is translated into focused strategies.

For more on trading strategy development, four excellent blogs to follow are:

Friday, July 13, 2007

The TradingMarkets 5% VIX Rule

TradingMarkets is one of many proponents of using the 10 day simple moving average of the VIX to help time one’s exposure to the broader markets. In their own words:

The proper way to use the VIX is to look at where it is today relative to its 10 day simple moving average. The higher it is above the 10 day moving average, the greater the likelihood the market is oversold and a rally is near. On the opposite side, the lower it is below the 10 day moving average, the more the market is overbought and likely to move sideways-to-down in the near future.

This wisdom is further distilled into what TradingMarkets calls The Trading Markets 5% Rule: “Do not buy stocks (or the market) anytime the VIX is 5% below its [10 day simple] moving average.”

Today the CXO Advisory Group is out with their analysis of the 5% rule. They conclude that “the TradingMarkets 5% VIX rule is of limited practical use and does not support a standalone trading strategy that keeps up with buy-and-hold.”

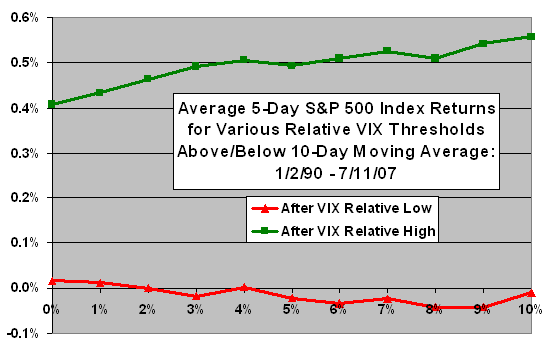
But before you click on to the next story, you should note that the CXO analysis actually goes far beyond an evaluation of the 5% rule and looks at returns for the S&P 500 index for all 1% increments from 0-10% above and below the 10 day SMA. CXO’s graph of the results, which I have included below, clearly shows that the 5 day SPX return is strongly correlated with increasingly higher readings in the VIX’s 10 day SMA. This should be of no surprise to regular readers, who by now are surely used to feeding at the trough of mean reversion.

The difficulty, according to CXO, lies in translating the VIX-related edge into a trading system that beats a buy and hold strategy, particularly when the 5% rule calls for being in the market only about 55% of the time.

My take is that the TradingMarkets 5% rule, just like the MarketSci.com approach I outlined last week, is a valid and tradeable way to use the VIX to time the markets. For better or for worse, for now I will leave it up to readers to see how well they can use this data to develop a robust trading system that can outperform a buy and hold approach.

As Emperor Joseph II was fond of saying in Amadeus, “Well, there it is.”

Tuesday, July 3, 2007

Using the VIX as a Timing Tool for the SPY

Since I am still playing a little bit of catch-up today, I am going to piggy-back on some third party content for today’s post. Specifically, I want to introduce some ideas from MarketSci.com on how to use the VIX to trade the SPY. In a three part series which I have linked below, MarketSci lays out three systems which use the VIX to time SPY trades. These include a long-term system using a 186 day VIX SMA which Barron’s cited in December 2006 as being developed by Credit-Suisse; an 11 day EMA-SMA VIX crossover system; and an 11 day EMA-SMA system which utilizes both the VIX and the SPY as triggers:

Part 1: Long-term Trading with the VIX – 20% deviations from the 186 day VIX SMA

Part 2: Short-term Trading with the VIX – an 11 day EMA-SMA VIX crossover system

Part 3: Our Spin on Trading with the VIX – a combined 11 day EMA-SMA VIX and SPY system

In many respects, these approaches are the SPY complement to the VIX mean reversion plays that I blog about on a regular basis in this space. Of course, unlike the VIX, trading the SPY has the benefit of being able to go long or short the ETF, use 2x leverage long with the SSO or short with the SDS, and use options on the underlying.

So far I have shied away from discussing the VIX as a market timing tool, but as I have increasingly become convinced of its applicability in this area, expect to hear more from me on this in the future.

Sunday, January 7, 2007

VIX and More: An Introduction

As the first entry in what I expect will be a relatively long-lived venture, I am going to step back a minute and provide some context.

First, why do I care about the VIX? Is it a better indicator than some of the other calculations or market volatility or, more broadly, investor sentiment? The answer to those questions will be addressed in future entries, but unlike other sentiment indicators, one can trade options (since February 2006) and futures (since March 2004) on the VIX in a fairly liquid market, with 14 years of historical data to provide fodder for trading strategy development:

More importantly, even a cursory inspection of the VIX data shows that there is a strong tendency to revert to the mean. As a result, oscillators such as the CCI, Williams %R, and RSI, among others, are reliable in terms of calling tops and bottoms in the VIX. The bottom line is that this makes the VIX highly tradeable. For more information on publicly disclosed VIX trading strategies, check out:

Looking at the weekly and daily charts of the VIX,


you can see that big moves rarely last more than 2-3 weeks before reverting to the mean. For this reason, as a general rule, it is a good idea to start harvesting profits after no less than 3-4 days and look to close out positions in no more than 10-20 trading days.

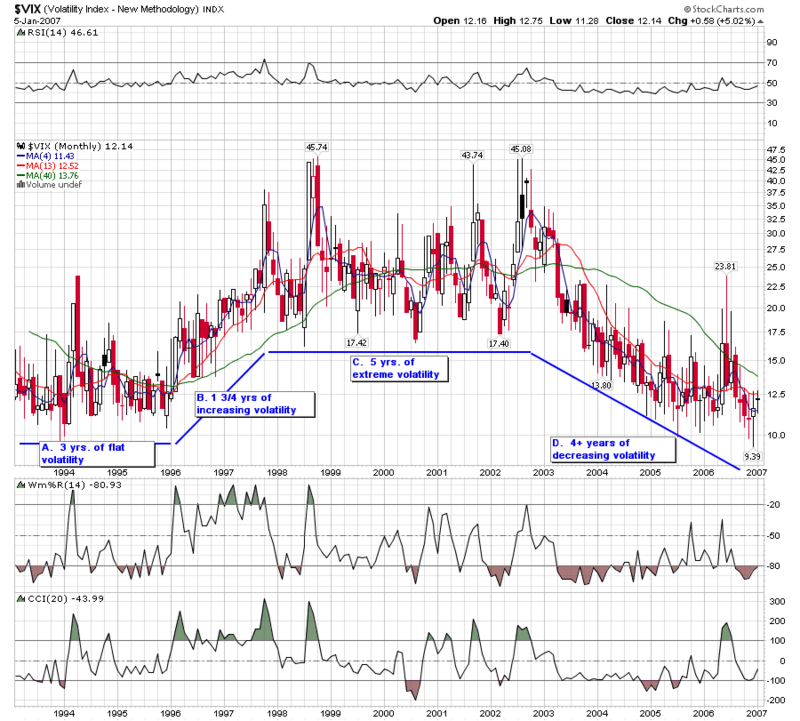
Where does the VIX currently stand? Pulling back to the 30,000 foot level and looking at the VIX monthly chart
Monthly VIX

we identify four macro-periods:

  1. relatively low, flat volatility for 3 years from 1/93 to 1/96
  2. increasing volatility for 1 ¾ years from 1/96 to 9/97
  3. a five year period of extreme volatility from 9/97 to 9/02
  4. the current period of decreasing volatility that began in 4/02 and continues to the present

The macro question is when the current trend of decreasing volatility will end and if we will see volatility back in the 20s for more than a couple of days a year.

The micro perspective, which I use for trading, looks back at most 3-6 months, typically more like 10-20 days. Since the mid-December bottom, the VIX has been trending up, but without the dramatic spike that pulls it significantly away from various moving averages. Right now I am slightly bearish on the VIX and would look to buy puts if the VIX moves over 13.30 in the next few days.

Having touched lightly on several topics above, I intend to drill down in more detail in the coming weeks.

Some future topics I am also aiming to cover here:

  1. Trading the VIX around options expiration week
  2. Trading the VIX near FOMC decision days
  3. The VIX as a contrary indicator
  4. Using the VIX in concert with other indicators

DISCLAIMER: "VIX®" is a trademark of Chicago Board Options Exchange, Incorporated. Chicago Board Options Exchange, Incorporated is not affiliated with this website or this website's owner's or operators. CBOE assumes no responsibility for the accuracy or completeness or any other aspect of any content posted on this website by its operator or any third party. All content on this site is provided for informational and entertainment purposes only and is not intended as advice to buy or sell any securities. Stocks are difficult to trade; options are even harder. When it comes to VIX derivatives, don't fall into the trap of thinking that just because you can ride a horse, you can ride an alligator. Please do your own homework and accept full responsibility for any investment decisions you make. No content on this site can be used for commercial purposes without the prior written permission of the author. Copyright © 2007-2023 Bill Luby. All rights reserved.
 
Web Analytics