Showing posts with label fade trade. Show all posts

Tuesday, January 22, 2008

Portfolio A1 Falls as Mosaic’s Run Comes to an End

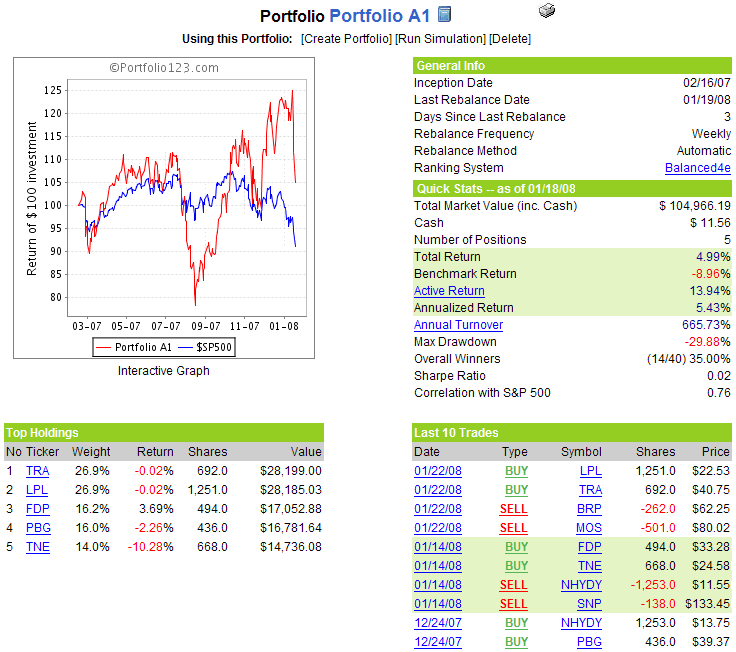
It was fun while it lasted, but it had to come to an end eventually. The Mosaic Company (MOS), which had run up an eye opening 176% in the first five months it was in Portfolio A1, is now gone from stable, victim of a rule that automatically culls any stock that falls 20% from the high recorded during the holding period. Also shown the door as a result of a 20% drop is Brazil Telecom Participacoes (BRP).

Replacing MOS and BRP are LG Philips LCD Co. (LPL) and Terra Industries (TRA). LG Philips LCD Co. is a Seoul-based $16 billion joint venture in the display business between two global giants, LG Electronics and Royal Philips Electronics. TRA, a nitrogen fertilizer company, demonstrates how some portfolio ‘rules’ can backfire, as this company is a direct competitor of Mosaic in the fertilizer business and at only 10% of Mosaic’s market capitalization is actually a much riskier play in this sector. Nevertheless, the stock ranker has spoken and TRA should do well if this week turns out to be a bottom. As far as the wisdom of holding an LCD manufacturer at a point where consumer demand appears to be drying up, I am skeptical, but this remains a 100% mechanical portfolio, where my perspective does not matter.

After falling 11.4% last week, Portfolio A1 is still sporting a 5% gain since the February 16, 2007 inception, considerably better than the 9% loss in the benchmark S&P 500 index during the same period.

There no other changes to the portfolio this week.

A snapshot of the Portfolio A1 is as follows:
Sunday, January 7, 2007

VIX and More: An Introduction

As the first entry in what I expect will be a relatively long-lived venture, I am going to step back a minute and provide some context.

First, why do I care about the VIX? Is it a better indicator than some of the other calculations or market volatility or, more broadly, investor sentiment? The answer to those questions will be addressed in future entries, but unlike other sentiment indicators, one can trade options (since February 2006) and futures (since March 2004) on the VIX in a fairly liquid market, with 14 years of historical data to provide fodder for trading strategy development:

More importantly, even a cursory inspection of the VIX data shows that there is a strong tendency to revert to the mean. As a result, oscillators such as the CCI, Williams %R, and RSI, among others, are reliable in terms of calling tops and bottoms in the VIX. The bottom line is that this makes the VIX highly tradeable. For more information on publicly disclosed VIX trading strategies, check out:

Looking at the weekly and daily charts of the VIX,


you can see that big moves rarely last more than 2-3 weeks before reverting to the mean. For this reason, as a general rule, it is a good idea to start harvesting profits after no less than 3-4 days and look to close out positions in no more than 10-20 trading days.

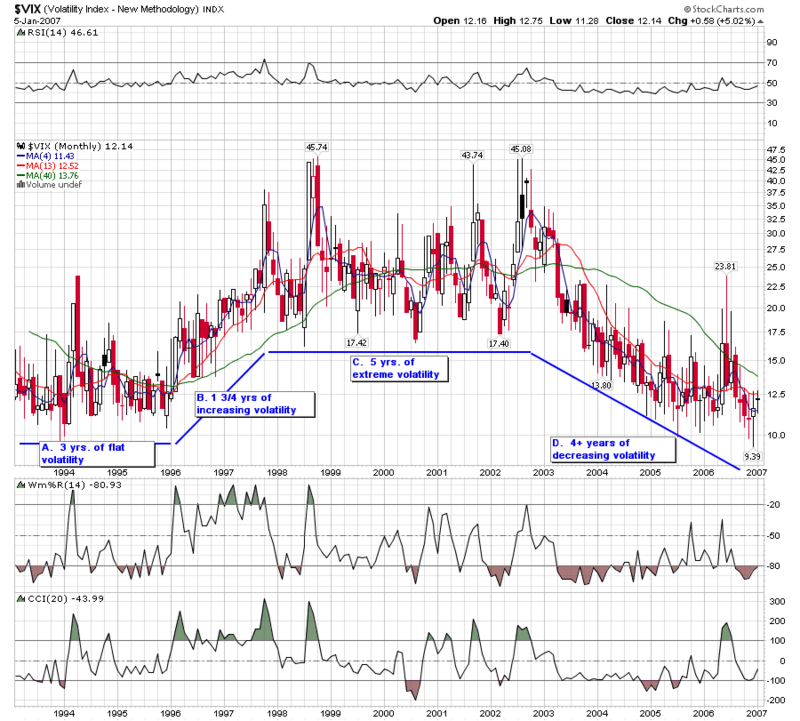
Where does the VIX currently stand? Pulling back to the 30,000 foot level and looking at the VIX monthly chart
Monthly VIX

we identify four macro-periods:

  1. relatively low, flat volatility for 3 years from 1/93 to 1/96
  2. increasing volatility for 1 ¾ years from 1/96 to 9/97
  3. a five year period of extreme volatility from 9/97 to 9/02
  4. the current period of decreasing volatility that began in 4/02 and continues to the present

The macro question is when the current trend of decreasing volatility will end and if we will see volatility back in the 20s for more than a couple of days a year.

The micro perspective, which I use for trading, looks back at most 3-6 months, typically more like 10-20 days. Since the mid-December bottom, the VIX has been trending up, but without the dramatic spike that pulls it significantly away from various moving averages. Right now I am slightly bearish on the VIX and would look to buy puts if the VIX moves over 13.30 in the next few days.

Having touched lightly on several topics above, I intend to drill down in more detail in the coming weeks.

Some future topics I am also aiming to cover here:

  1. Trading the VIX around options expiration week
  2. Trading the VIX near FOMC decision days
  3. The VIX as a contrary indicator
  4. Using the VIX in concert with other indicators

DISCLAIMER: "VIX®" is a trademark of Chicago Board Options Exchange, Incorporated. Chicago Board Options Exchange, Incorporated is not affiliated with this website or this website's owner's or operators. CBOE assumes no responsibility for the accuracy or completeness or any other aspect of any content posted on this website by its operator or any third party. All content on this site is provided for informational and entertainment purposes only and is not intended as advice to buy or sell any securities. Stocks are difficult to trade; options are even harder. When it comes to VIX derivatives, don't fall into the trap of thinking that just because you can ride a horse, you can ride an alligator. Please do your own homework and accept full responsibility for any investment decisions you make. No content on this site can be used for commercial purposes without the prior written permission of the author. Copyright © 2007-2023 Bill Luby. All rights reserved.
 
Web Analytics