Showing posts with label oscillators. Show all posts

Monday, December 22, 2008

The VIX, Lehman Brothers, and Forecasting

Jeff Kearns and Michael Tsang of Bloomberg have an article out today (VIX Fails to Forecast S&P 500 Drop, Loses Followers) in which the authors contend that largely because the VIX failed to predict the October losses in the S&P 500 index (SPX), the VIX is no longer considered to be an accurate gauge of future market activity.

One of the central claims made by Kearns and Tsang regarding the lack of effectiveness of the VIX is stated as follows:

“On Sept. 11, less than a week before New York-based Lehman Brothers Holdings Inc. went bankrupt and four days after the government takeovers of Washington-based Fannie Mae and McLean, Virginia-based Freddie Mac, the VIX closed at 24.39. That meant traders bet the S&P 500 wouldn’t fluctuate more than 24.39 percent on an annualized basis, or about 7 percent in the next 30 days, and implied a range for the index of 1,161.11 to 1,336.99.

One month later, on Oct. 10, the S&P 500 closed at 899.22, or a record 23 percent lower than what the VIX predicted.”

As fellow blogger Don Fishback was quick to point out, the VIX calculation actually estimates one standard deviation of annualized 30 day volatility expectations in SPX options. That standard deviation, of course, is meant to capture 68.3% of the Gaussian or normal distribution of prices. In fact, the distribution of VIX prices does not follow a normal distribution, but even if it did, the movements from September 11th to October 10th would not be that statistically improbable.

Some quick comments on the math involved here. Using a VIX of 24.39, the conversion of an annualized volatility of 24.39% to 30 day volatility yields a 30 day volatility of 7.04%. Two standard deviations translate into a 30 day volatility of +/- 14.08% and should cover about 95.5% of the normal distribution (I am assuming a normal distribution for the sake of mathematical simplicity). Three standard deviations increase the range of expected volatility to +/- 21.12% and should capture about 99.7% of the normal distribution. In fact, the 99.9% boundary for the normal distribution is 3.29 standard deviations and translates into expectations of an SPX move of 23.16%, about on par with what transpired. So, given that an event which falls outside of 99.9% probability distribution happens once every 1000 instances. Rare indeed, but not unfathomable.

Of course there are many ways in which to utilize the VIX to aid in market timing. Consider that the nature of the VIX calculation is such that the VIX acts as an unbounded oscillator whose values are derived from prices paid for options on the SPX. Like most oscillators, traders tend to use extreme values as opportunities to bet on a reversion to the mean.

A good deal of the difficulty in understanding the movements of the VIX is that some of the dominant patterns are different over the course of different time horizons. For instance, in the short-term, the VIX commonly spikes and mean reverts. Looking at the intermediate term, the VIX frequently establishes strong trends; and in the long term, the VIX has a tendency to move in cycles of 2-4 years. For the month of September and most of the month of October, the VIX was in an uncharacteristically strong sustained uptrend.

Part of the reason for the sharp move in the VIX during September and October is that it is highly dependent upon macroeconomic and fundamental events that help to shape investor perceptions of uncertainty, risk and fear. In the week leading up to the Lehman Brothers bankruptcy, for instance, very few investors believed that the government was prepared to let Lehman fail. Additionally, in retrospect is seems as if those who did believe failure was an option did not comprehend the nature of the systemic reverberations that a Lehman bankruptcy would trigger.

The bottom line is that during the second week in September, the VIX was pricing in a very low probability of a Lehman Brothers bankruptcy. Perhaps more important, investors were also assigning a significantly lower systemic threat potential as a result of the dominoes associated with a Lehman bankruptcy.

Ultimately, it took a full six weeks of a steadily trending VIX for the market to fully price in the global systemic risks associated with the sequence of events that began with the Lehman Brothers bankruptcy.

Consider that the prices and implied volatilities of SPX options have to account not just for the probabilities associated with various future scenarios, but also the magnitude of the impact of those scenarios on the stock market. For this reason, even while some of the probabilities may not have varied significantly from day to day during September and October, as the magnitude of the financial crisis was slowly revealed, the VIX continued to ratchet higher – and investors reacted to a rising VIX with increasing alarm.

Getting back to the question posed by Kearns and Tsang, yes the VIX underestimated future volatility back on September 11th. At that time, the prediction of a four year flood was consistent with mainstream thinking. Very few observers anticipated the SPX falling below 800 by Thanksgiving.

As the year winds down, I will have more about what we learned about volatility in 2008 and what some of the implications are for 2009 and beyond.

Monday, February 11, 2008

NASDAQ Summation Index

When it comes to market breadth indicators, I have particular fondness for the McClellan Summation Index, which I have discussed in this space several times in the past year. While the McClellan Summation Index draws upon NYSE advance decline data, I am actually a little bit partial to the NASDAQ variant. For those who use StockCharts.com, the ticker for the NASDAQ summation index is NASI and the NYSE/McClellan version is the NYSI.

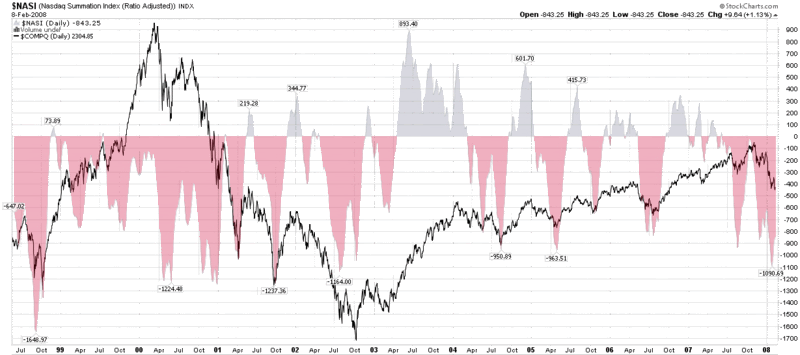
So here is the big question: is the historically low NASI advance decline data a buying opportunity or a warning sign?

In order to best answer that question, I have included a chart below that plots NASI data going back ten years. It clearly shows that buying on any significant NASI dip (say -900 or lower) since the October 2002 bottom has been an excellent investment tactic, as was the run up to the 2000 market top. The graph also shows, however, that during the 2000-2002 bear market, this was a risky strategy that tried to capture short bounces which were brief countertrends against a falling tide. It was possible to be successful, but tight stops and/or a narrow time horizon were needed to control risk.

When all is said and done, we are back to a discussion about whether it makes sense to buy on the dips. In a well defined uptrend, there is not doubt that this is a winning strategy. In a bear market, one can still make money on the bullish countertrend, but these need to be surgical strikes. There isn’t much in the way of sideways action evident in this long-term chart, but it is safe to conclude that buying on the dips in a non-trending market – classic oscillator-based trading – is less profitable than trading with the trend, but offers more substantially opportunity than trying to trade against it.

My current reading of the NASI is that we are more likely than not to get a bounce off of current levels; if it turns out we are in a bear market, these gains will be short-lived, but if we are putting in a bottom of at least intermediate-term length, there is considerable opportunity to the upside.

Sunday, January 7, 2007

VIX and More: An Introduction

As the first entry in what I expect will be a relatively long-lived venture, I am going to step back a minute and provide some context.

First, why do I care about the VIX? Is it a better indicator than some of the other calculations or market volatility or, more broadly, investor sentiment? The answer to those questions will be addressed in future entries, but unlike other sentiment indicators, one can trade options (since February 2006) and futures (since March 2004) on the VIX in a fairly liquid market, with 14 years of historical data to provide fodder for trading strategy development:

More importantly, even a cursory inspection of the VIX data shows that there is a strong tendency to revert to the mean. As a result, oscillators such as the CCI, Williams %R, and RSI, among others, are reliable in terms of calling tops and bottoms in the VIX. The bottom line is that this makes the VIX highly tradeable. For more information on publicly disclosed VIX trading strategies, check out:

Looking at the weekly and daily charts of the VIX,


you can see that big moves rarely last more than 2-3 weeks before reverting to the mean. For this reason, as a general rule, it is a good idea to start harvesting profits after no less than 3-4 days and look to close out positions in no more than 10-20 trading days.

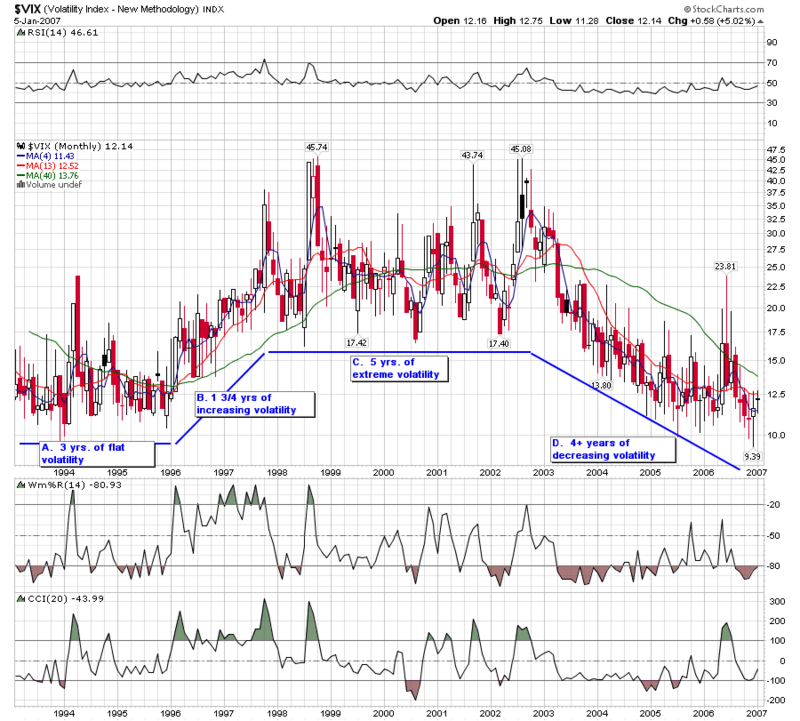
Where does the VIX currently stand? Pulling back to the 30,000 foot level and looking at the VIX monthly chart
Monthly VIX

we identify four macro-periods:

  1. relatively low, flat volatility for 3 years from 1/93 to 1/96
  2. increasing volatility for 1 ¾ years from 1/96 to 9/97
  3. a five year period of extreme volatility from 9/97 to 9/02
  4. the current period of decreasing volatility that began in 4/02 and continues to the present

The macro question is when the current trend of decreasing volatility will end and if we will see volatility back in the 20s for more than a couple of days a year.

The micro perspective, which I use for trading, looks back at most 3-6 months, typically more like 10-20 days. Since the mid-December bottom, the VIX has been trending up, but without the dramatic spike that pulls it significantly away from various moving averages. Right now I am slightly bearish on the VIX and would look to buy puts if the VIX moves over 13.30 in the next few days.

Having touched lightly on several topics above, I intend to drill down in more detail in the coming weeks.

Some future topics I am also aiming to cover here:

  1. Trading the VIX around options expiration week
  2. Trading the VIX near FOMC decision days
  3. The VIX as a contrary indicator
  4. Using the VIX in concert with other indicators

DISCLAIMER: "VIX®" is a trademark of Chicago Board Options Exchange, Incorporated. Chicago Board Options Exchange, Incorporated is not affiliated with this website or this website's owner's or operators. CBOE assumes no responsibility for the accuracy or completeness or any other aspect of any content posted on this website by its operator or any third party. All content on this site is provided for informational and entertainment purposes only and is not intended as advice to buy or sell any securities. Stocks are difficult to trade; options are even harder. When it comes to VIX derivatives, don't fall into the trap of thinking that just because you can ride a horse, you can ride an alligator. Please do your own homework and accept full responsibility for any investment decisions you make. No content on this site can be used for commercial purposes without the prior written permission of the author. Copyright © 2007-2023 Bill Luby. All rights reserved.
 
Web Analytics