VIX and More: An Introduction
As the first entry in what I expect will be a relatively long-lived venture, I am going to step back a minute and provide some context.
First, why do I care about the VIX? Is it a better indicator than some of the other calculations or market volatility or, more broadly, investor sentiment? The answer to those questions will be addressed in future entries, but unlike other sentiment indicators, one can trade options (since February 2006) and futures (since March 2004) on the VIX in a fairly liquid market, with 14 years of historical data to provide fodder for trading strategy development:
More importantly, even a cursory inspection of the VIX data shows that there is a strong tendency to revert to the mean. As a result, oscillators such as the CCI, Williams %R, and RSI, among others, are reliable in terms of calling tops and bottoms in the VIX. The bottom line is that this makes the VIX highly tradeable. For more information on publicly disclosed VIX trading strategies, check out:


you can see that big moves rarely last more than 2-3 weeks before reverting to the mean. For this reason, as a general rule, it is a good idea to start harvesting profits after no less than 3-4 days and look to close out positions in no more than 10-20 trading days.
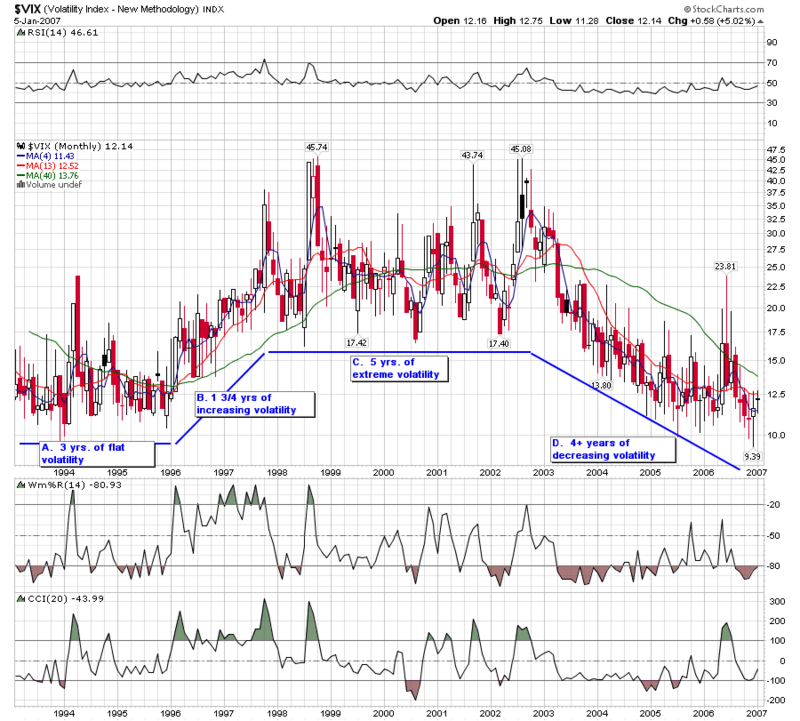
we identify four macro-periods:
- relatively low, flat volatility for 3 years from 1/93 to 1/96
- increasing volatility for 1 ¾ years from 1/96 to 9/97
- a five year period of extreme volatility from 9/97 to 9/02
- the current period of decreasing volatility that began in 4/02 and continues to the present
The macro question is when the current trend of decreasing volatility will end and if we will see volatility back in the 20s for more than a couple of days a year.
Having touched lightly on several topics above, I intend to drill down in more detail in the coming weeks.
- Trading the VIX around options expiration week
- Trading the VIX near FOMC decision days
- The VIX as a contrary indicator
- Using the VIX in concert with other indicators


0 comments:
Post a Comment