Showing posts with label TradingMarkets 5% Rule. Show all posts

Thursday, June 25, 2009

VIX:VXV Ratio Sell/Short Signal

The VIX closed at 26.36 today, down 15.4% from Monday’s close of 31.17 to the lowest closing level since the 25.66 close on September 12, 2008 – the last trading day before the Lehman Brothers bankruptcy was announced.

According to the classic 10 day simple moving average measure, which has the VIX currently sitting 11.7% below that level, the VIX is now in an ‘oversold’ position according to the TradingMarkets 5% Rule as well as a more stringent 10% threshold used by other traders.

From a volatility term structure perspective, the VIX is also oversold. Notably, the VIX:VXV ratio, which compares 30-day volatility of SPX options to 93-day volatility (using the VXV index), closed today at 0.896 today. In the chart below, you can see that when this ratio closes at 0.92 or below, the bears tend to have an upper hand for at least several weeks. When the ratio drops below 0.90, as was the case today, the odds shift even more favorably in the direction of the bears.

In brief, the low current levels in the VIX:VXV ratio suggest that options traders are too bullish and complacent in their 30 day outlook (event volatility) relative to their 93 day outlook (structural volatility.) While these two volatility measures can be brought back into line by lowering estimates of long-term structural volatility, the path of least resistance is for short-term event volatility to rise. This means the odds favor that the VIX will move in the direction of the VXV, which closed at 29.41 today. Of course rising volatility tends to favor the bears at the expense of the bulls. Even with today’s exceptionally strong close, longs should consider taking profits and/or initiating short positions.
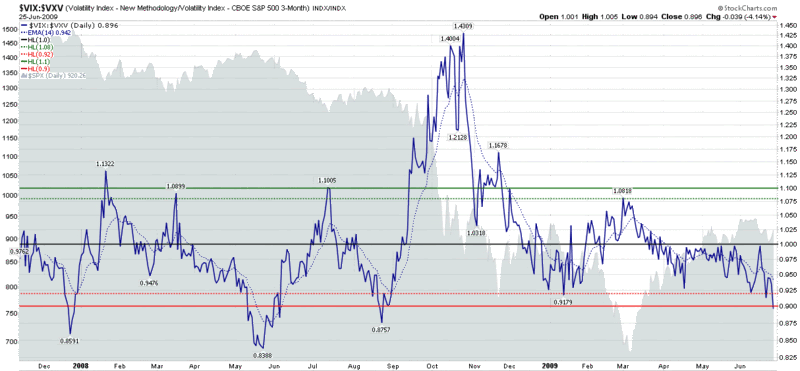
[source: StockCharts]

Disclosure: Long VIX at time of writing.

Thursday, January 8, 2009

MarketSci Looks at the VIX 5% Rule

MarketSci is a blog that somehow manages to ponder the same sort of issues that I like to chew on. Fortunately, MarketSci does more than ponder. In fact, much like the approach favored by Quantifiable Edges, MarketSci seems to aspire to being the mythbusters of the investment world.

This week MarketSci has particularly interesting series of items on its plate: the Trading Markets 10 Trading Rules. One by one, MarketSci is taking a data-driven approach to determining the usefulness of each of the Trading Markets rules.

In today’s installment, Testing TM Rule #5: the VIX 5% Rule, MarketSci examines the popular TradingMarkets 5% rule that I discussed in 2007 in a post with the unlikely title of The TradingMarkets 5% VIX Rule. In short, MarketSci comes down on the side of the usefulness of the 5% rule as a defensive measure. The full analysis is worth clicking through for, as are the other installments in the analysis of the ten trading rules, most of which are consistent with my own thinking and several of which should probably be part of every trader’s arsenal.

Friday, January 2, 2009

Schaeffer and Connors: Two Veteran Perspectives on the VIX

While I wait to see if the VIX might find a new floor in the 30-35 range, I notice that two veteran VIX aficionados, Bernie Schaeffer and Larry Connors, are talking about their current views on the VIX.

Starting with Schaeffer, in Examining the Technicals of the CBOE Market Volatility Index (VIX), the veteran options strategist outlines several of the factors that are influencing his recent thinking on the VIX. Republished from a mid-December subscriber note, Schaeffer’s thinking includes:

  • Possible support at the ‘half high’ level of the VIX (50% of the November peak of 89.53)
  • The importance of round numbers (a VIX of 50)
  • Long-term moving averages (40 week and 80 week)
  • Sector correlation (especially commodities vs. financials)
  • VIX relative to SPX historical volatility (20 day HV)

David Penn, Editor in Chief at Connors’ TradingMarkets.com, weighed in earlier in the week with In Defense of the VIX, a response to a Bloomberg article by Jeff Kearns and Michael Tsang. Penn favors a relative VIX to an absolute VIX and cites the familiar Connors 5% rule, in which investors should be long the market when the VIX is 5% or more above its 10 day simple moving average and short when the VIX is 5% or more below the 10 day SMA. For those who are interested in learning more about the Connors approach, Short-Term Trading Strategies that Work has some interesting ideas and is a worthy successor to How Markets Really Work: A Quantitative Guide to Stock Market Behavior.

Friday, July 13, 2007

The TradingMarkets 5% VIX Rule

TradingMarkets is one of many proponents of using the 10 day simple moving average of the VIX to help time one’s exposure to the broader markets. In their own words:

“The proper way to use the VIX is to look at where it is today relative to its 10 day simple moving average. The higher it is above the 10 day moving average, the greater the likelihood the market is oversold and a rally is near. On the opposite side, the lower it is below the 10 day moving average, the more the market is overbought and likely to move sideways-to-down in the near future.”

This wisdom is further distilled into what TradingMarkets calls The Trading Markets 5% Rule: “Do not buy stocks (or the market) anytime the VIX is 5% below its [10 day simple] moving average.”

Today the CXO Advisory Group is out with their analysis of the 5% rule. They conclude that “the TradingMarkets 5% VIX rule is of limited practical use and does not support a standalone trading strategy that keeps up with buy-and-hold.”

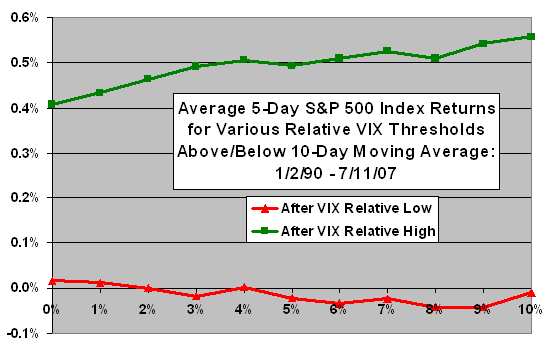
But before you click on to the next story, you should note that the CXO analysis actually goes far beyond an evaluation of the 5% rule and looks at returns for the S&P 500 index for all 1% increments from 0-10% above and below the 10 day SMA. CXO’s graph of the results, which I have included below, clearly shows that the 5 day SPX return is strongly correlated with increasingly higher readings in the VIX’s 10 day SMA. This should be of no surprise to regular readers, who by now are surely used to feeding at the trough of mean reversion.

The difficulty, according to CXO, lies in translating the VIX-related edge into a trading system that beats a buy and hold strategy, particularly when the 5% rule calls for being in the market only about 55% of the time.

My take is that the TradingMarkets 5% rule, just like the MarketSci.com approach I outlined last week, is a valid and tradeable way to use the VIX to time the markets. For better or for worse, for now I will leave it up to readers to see how well they can use this data to develop a robust trading system that can outperform a buy and hold approach.

As Emperor Joseph II was fond of saying in Amadeus, “Well, there it is.”

DISCLAIMER: "VIX®" is a trademark of Chicago Board Options Exchange, Incorporated. Chicago Board Options Exchange, Incorporated is not affiliated with this website or this website's owner's or operators. CBOE assumes no responsibility for the accuracy or completeness or any other aspect of any content posted on this website by its operator or any third party. All content on this site is provided for informational and entertainment purposes only and is not intended as advice to buy or sell any securities. Stocks are difficult to trade; options are even harder. When it comes to VIX derivatives, don't fall into the trap of thinking that just because you can ride a horse, you can ride an alligator. Please do your own homework and accept full responsibility for any investment decisions you make. No content on this site can be used for commercial purposes without the prior written permission of the author. Copyright © 2007-2023 Bill Luby. All rights reserved.
 
Web Analytics