Showing posts with label term structure. Show all posts

Monday, April 4, 2022

VIX ETPs – What Can Go Wrong?

For many years, I’ve had a tagline at the bottom of my email: “In volatility there is opportunity!”  The tagline is a reminder that when things look darkest in the financial markets, this is often an area of maximum opportunity.

On the other hand, the VIX ETPs have quite a few quirks and as a result of these quirks and their high volatility, there are considerable risks for both longs and shorts.  How much risk?  Quite a lot.  Consider that on a split-adjusted basis, the +2x long TVIX launched at 2.66 billion (not a typo!) and trades anywhere from less than a dollar (the TVIX.IV indicative value) to 2.45 TVIXF (on the pink sheets), depending upon how you wish to measure the magnitude of the bloodbath.  On the other side of the coin, the -1x short XIV fell 93% on one day back in the February 2018 volatility spike now known as Volmageddon that resulted in an acceleration event (triggered when the price of XIV fell by more than 80% on a single day) and the closing of XIV.

From the 30,000-foot perspective, the big risk in being short volatility is that a big one-day VIX spike can theoretically destroy the value of your entire position.  On the other hand, the big risk in being long volatility is that you die a death by a thousand cuts and suffer the same 85% per year compound annual decline experienced by a product like TVIX.

There are many individual risk factors that are responsible for the total risk of an individual VIX ETP.  I have spelled out a number of these in the past, spending considerable time on contango and negative roll yield.  Way back in May 2009, I summarized some of my thinking in the likes of VXX Calculations, VIX Futures and Time Decay and elaborated on some of those themes in October 2009 in Why VXX Is Not a Good Short-Term or Long-Term Play.  I also addressed the subject of how reverse splits are the only thing keeping some of these products from falling to zero in Will TVIX Go to Zero? in February 2012.  In that post, I highlighted this gem from the TVIX prospectus:

“The long term expected value of your ETNs is zero. If you hold your ETNs as a long-term investment, it is likely that you will lose all or a substantial portion of your investment.”

One of my better summaries of the factors putting downward pressure on the price of TVIX came in Four Key Drivers of the Price of TVIX in 2012.  Here is the meat of that post:

1.  Volatility – this seems obvious, but in the short-term, the movements of the front month and second month VIX futures explain almost all of the change in the price of TVIX. For day traders, TVIX becomes essentially a substitute for trading the VIX futures and with the exception of leverage, the other factors below are inconsequential.

2.  Leverage – another obvious factor, the 2x leverage in TVIX means that on average it moves about as quickly up and down in percentage terms as the VIX does and twice as quickly as a basket of front month and second month VIX futures. In the short-term, leverage means mostly that the moves in the underlying are exaggerated; in the long-term, leverage enhances volatility compounding and has a negative impact on price.

3.  Contango – thanks to the emergence of VIX ETPs as the cornerstone of volatility as an asset class, issues related to the VIX futures term structure in general and contango and negative roll yield in particular have become among the most frequently discussed issues in this space. Simply stated, the front month and second months of VIX futures are in contango more than 75% of the time, with the result being a monthly drag on TVIX’s price that exceeds the current annual yield on the 30-Year U.S. Treasury bond.

4.  Volatility compounding – the more volatility a leveraged security exhibits, the more that volatility will have a negative impact on performance over an extended period. The issue is the same as someone who owns a dress shop and marks the dress down 50% and then up 50% or reverses the chronology and marks the dress up 50% and then down 50%. Either way, the value of that dress declines by 25%. The same is true for leveraged ETPs and the degree of the price decay is a direct function of volatility.

While the number of VIX ETNs is dwindling, ETNs have their own set of issues, as these are debt securities – essentially a promise to pay the value of the underlying index – rather than a portfolio of VIX futures, as is the case with VIX ETFs.  We have seen issues related to VIX ETNs come to the fore with TVIX in 2012 when Credit Suisse suspended new creation units in TVIX only to resume new creation units a little more than a month later – roiling the supply and demand dynamics as well as the TVIX market price in both directions.  Last month something similar happened with Barclays and VXX when Barclays suspended new creation units in this product.  There are issues related to ETNs that are unique to these types of securities and include credit risk, counterparty risk, price risk relative to indicative value, etc.  The SEC summarizes some of these ETN-specific risks in this investor bulletin.

If you want to better understand some of the risk factors involved in these products, I highly recommend you review the prospectuses of some of the following ETNs and ETFs:

I am often asked if these products were designed to go to zero.  No, they were not designed to go to zero.  The original intent was that these products would be short-term hedging or speculative instruments for institutions.  They do, however, have structural flaws that begin to appear as soon as these products are held for more than one day.  Over time, these structural flaws compound and will dominate the price action.

For all the reasons state above, I urge anyone considering trading VIX ETPs to review all relevant prospectuses and make a concerted effort to educate yourself on the products, their price histories and the reasons behind those price movements.  For those who insist on trading these products, it is always safest to consider defined risk trades so that the maximum loss is known in advance.  This may be a long position, a long or short position with an options hedge, or an options position such as a vertical spread that is a defined risk trade.

In the graphic below, I show the lifetime history of TVIX/TVIXF in black and TVIX.IV in red (it was the same as TVIX until it was delisted in July 2020).  Note that the Y-axis is on a log scale so that the data captures the relatively constant percentage declines, rather than the precipitous drop in price.  For fun, try to pick out any major spike in volatility on this chart other than the pandemic.

[source(s):  Yahoo, VIX and More]

Further Reading:
VXX Upside vs. Downside Risk with No New Creation Units
Barclays Suspends Creation Units for VXX
Four Key Drivers of the Price of TVIX
Will TVIX Go to Zero?
TVIX Creation Units Return; What It Means for Investors
Credit Suisse Suspends Creation Units in TVIX: What it Means
Why VXX Is Not a Good Short-Term or Long-Term Play
VXX Calculations, VIX Futures and Time Decay
Using Options to Control Risk in Leveraged ETFs

For those who may be interested, you can always follow me on Twitter at @VIXandMore

Disclosure(s): net short VXX and UVXY, long SVIX at time of writing

Tuesday, May 2, 2017

Euro Zone VSTOXX ETNs Land on U.S. Beaches!

Think the market is too complacent about this weekend’s election in France?  Worried that the euro area is going to crumble under the weight of Italy’s struggles?  Convinced that Greece, Portugal or Spain are just one more kicked can away from a disaster?

As of tomorrow, investors in the U.S. will have another way to translate these ideas into actionable trades with tomorrow’s launch of two new exchange-traded notes (ETNs) – EVIX (long euro zone volatility) and EXIV (inverse euro zone volatility) – from VelocityShares and UBS that put a European face on existing U.S. VIX-based products such as VIIX and perennial favorite XIV.

Based on the VSTOXX, the VIX-like volatility index for the EURO STOXX 50 Index of 50 blue-chip stocks from 11 euro zone countries, EVIX and EXIV should be familiar to those who are knowledgeable about VXX and VIIX on the long volatility side as well as XIV and SVXY on the short volatility side.  EVIX and EXIV are based on VSTOXX futures and have a target maturity of 30 days – a maturity that is maintained by rolling a portion of the portfolio each day and therefore subjecting both products to the vagaries of contango and backwardation.  In the event these are terms you are not familiar with, I strongly recommend that you click on the links above and educate yourself.  Believe it or not, this is the ninth year I have been talking about the VIX futures term structure, negative roll yield, contango and backwardation.  (Those who have been paying attention since the early days of VXX and VXZ have no doubt profited mightily from this knowledge.)

The beauty of EVIX and EXIV is that these products create so much flexibility for investors who maintain a global, cross-asset class view of volatility.  In the run-up to the first round of the French election, for example, VSTOXX spiked dramatically and pushed the VSTOXX:VIX ratio below 1.00, creating some interesting arbitrage opportunities and/or pairs trades in the process.  Now investors can trade euro zone volatility against U.S. volatility, use targeted hedges for risk that is specific to the euro zone or speculate more easily about the direction of volatility in the euro zone.

I encourage everyone to study the EVIX and EXIV prospectus closely.

This is a huge development in the volatility space and if options on EVIX and EXIV follow later this week, as expected, the volatility trading landscape will be much richer and more diverse. 

Now if we can only get liquid volatility products for gold volatility (GVZ) and crude oil volatility (OVX), I won’t even have to set out a stocking next to the chimney this Christmas.

While I’m at it, why are there no options on XIV?  This is such a popular high-beta product that it deserves options so traders can express a broader range of opinions on volatility.  Readers, it never hurts to nudge the CBOE on these issues.  An outpouring of popular sentiment can make a difference.

As the risk of charging off into full rant mode, I feel compelled to say that I hope volatility investors know a good thing when they see it.  It is a shame that VXST futures did not attract enough attention to hang around and that VMAX and VMIN are not trading with higher volumes.  One of the best volatility products ever created, ZIV, nearly died of neglect before investors finally paid it some attention.

As I see it, EVIX and EXIV as well as VMAX and VMIN are test cases for the future of the breadth of volatility products.  If you would like a diverse tapestry of volatility products in the future, it would not hurt to “buy local” volatility ETPs rather than sticking to the handful of already successful products.  If you don’t vote with your feet, you had better be happy playing in a small and rather limited sandbox.  I am fond of saying, “In volatility, there is opportunity!” – but that opportunity is a function of the richness of the various volatility product platforms.

Last but not least, I know Eurozone and eurozone are the preferred spellings, but I am sticking to the two-word “euro zone” with as much stubbornness as I can muster.  What can I say, I am short convention…

Further Reading:

For those who may be interested, you can always follow me on Twitter at @VIXandMore

Disclosure(s): net short VXX and VMAX; net long XIV and ZIV at time of writing.  The CBOE is an advertiser on VIX and More.

Monday, January 2, 2017

The 2016 VIX Futures Term Structure: Extraordinarily Average

Two days ago, in The Year in VIX and Volatility (2016), I made no mention whatsoever of the VIX futures term structure.  Traders of the full range of VIX products (futures, options and ETPs) hopefully know by now that the entire VIX product landscape is based -- and priced -- off of VIX futures and one of the most important aspects of VIX futures is the shape of the term structure.

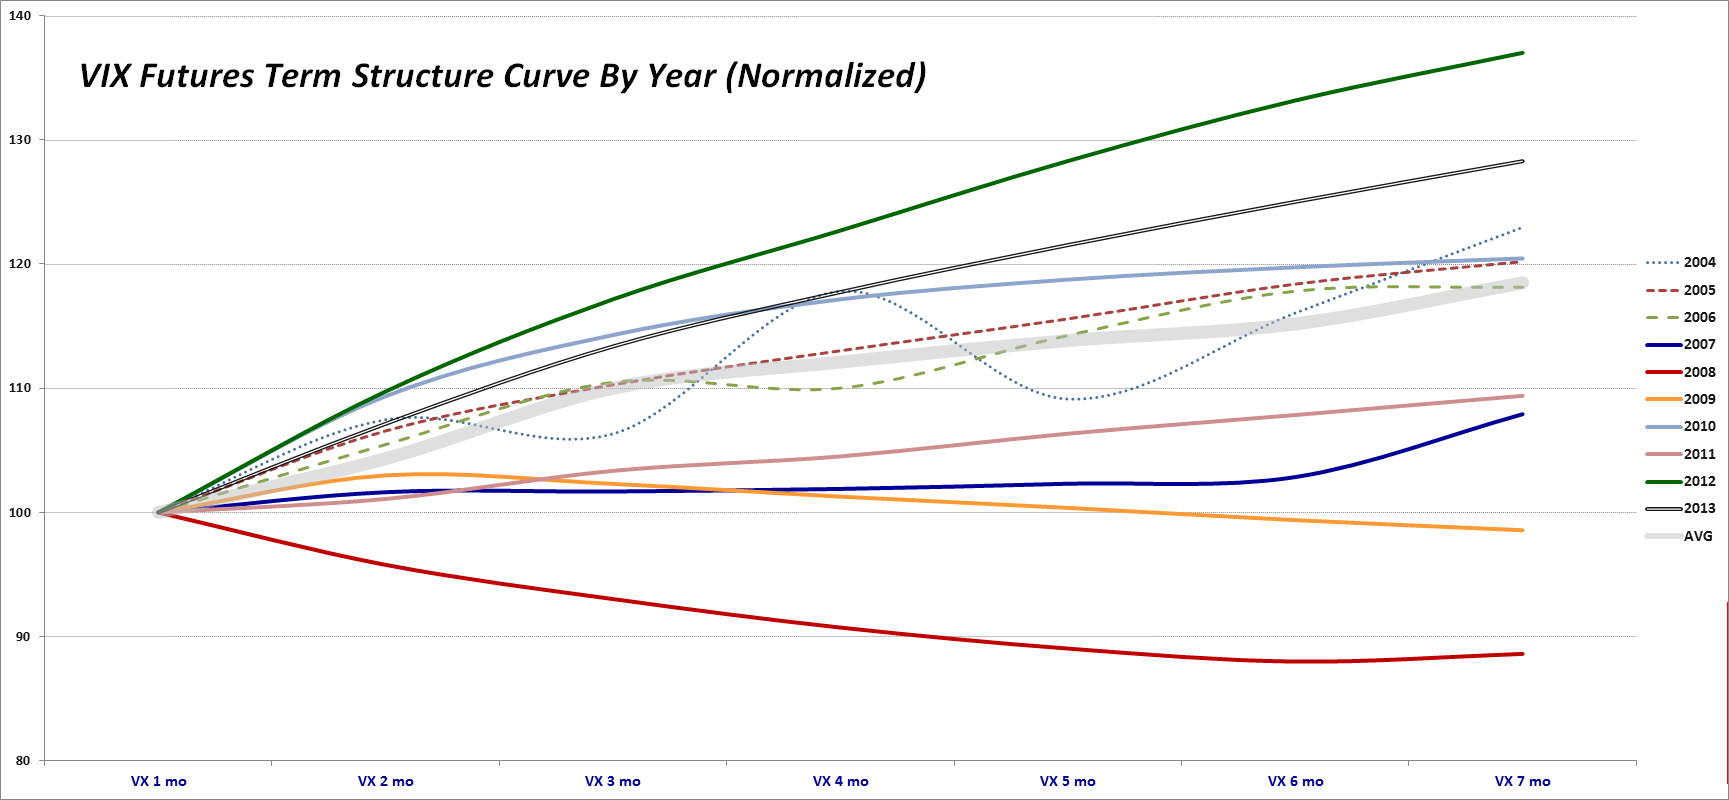
Long story short:  as the graphic below shows, the 2016 VIX futures term structure (double red line) was closer to its historical average (wide gray line) than any prior year since the launch of VIX futures in 2004, with the average term structure over the course of the year demonstrating a relatively modest upward sloping term structure, also known as contango.


[source(s) CBOE, VIX and More]

By way of explanation, the graphic above shows the average (mean) normalized term structure for each year since the VIX futures were launched. In normalizing the data, I have set the average front month VIX futures contract to 100 and have expressed the averages of the second through seven months as multiples of the front month.  Note that the terms structure lines are dotted and somewhat wavy for 2004 – 2006, due to the fact that the CBOE did not implement a full complement of consecutive monthly futures until October 2006.

In terms of takeaways, since I have not posted this graphic in two years, note that the term structure for 2015 was slightly flatter than average.  Looking back a couple more years, note that 2012 and 2013 saw the steepest term structure on record.  In the thirteen-year history of VIX futures, only two years saw a downward sloping term structure, also known as backwardation:  2008 and (barely, depending upon how one measures) 2009.

During the course of 2016, the VIX futures term structure moved into backwardation on four separate occasion and closed in backwardation on a total of 37 days – with 31 of those 37 days running consecutively from January 4th to February 16th.  These four instances and 37 days are just slightly below the average year, as can be seen in the graphic below.


[source(s) CBOE, VIX and More]

Last but not least, the average term structure for the year as well as the frequency and magnitude of the contango-backwardation dance is a strong determinant of the annual performance of the VIX ETPs and in my next post I will detail why 2016 was unlike the previous year, where Every Single VIX ETP (Long and Short) Lost Money in 2015.

Related posts:


For those who may be interested, you can always follow me on Twitter at @VIXandMore


Disclosure(s): the CBOE is an advertiser on VIX and More

Saturday, March 12, 2016

Playing Volatile Oil Prices (Guest Columnist at Barron’s)

Today I penned my eighteenth guest column for Barron’s, filling in for Steve Sears and the venerable The Striking Price options column.  Looking back, I was surprised to see that this is the eighth year I have been contributing to Barron’s and while I have generally tilted in the direction of volatility topics during this period, I always like to keep my thoughts topical, but with an unusual twist or two.

In Playing Volatile Oil Prices:  The ins and outs of the backspread trade, I tackled the recent huge moves in crude oil prices, touched upon some of the fundamental and technical influences on the price of crude and used the current environment of chaos following a huge short squeeze as a backdrop to talk about the opportunities associated with a call backspread.

As Barron’s prefers to structure trade ideas around ETPs or single stocks, I elected to use the popular U.S. Oil Fund (USO) ETP as my underlying, though I also like the idea of call backspreads in oil and gas exploration and production (XOP) or Russia (RSX), though the Russia ETP has limited liquidity.  As an aside, readers of this blog will surely know that the prices of futures-based ETPs such as USO and VXX, among others, are strongly influenced by the roll yield associated with the shape of the futures curve.  For this reason, USO acts most like West Texas Intermediate crude oil in the short-term, but over longer periods the price of USO is more strongly affected by the term structure of crude oil futures, similar to the issues associated with VXX and the VIX.

While the Barron’s column discusses the rationale for the trade and some of the details surrounding it, I thought I would post a profit and loss graphic for the USO April 1x2 10.5/11.5 call backspread here as a companion to the Barron’s material.


[source(s):  LivevolPro / CBOE, VIX and More]

I am sure this particular call backspread trade idea is not for everyone, yet I think it is important for everyone to internalize backspreads, their P&L chart and some of the tweaks that can be made.  For instance, one can dramatically change probabilities and payoffs by modifying strikes (including making use of in-the-money strikes, for instance) and expirations, whereas the credit or debit for entering the trade is something that can be strongly influenced by adjusting the ratios to the likes of 2x3, 4x5, etc.

Also of note, readers who are new to backspreads may wish to brush up on bear call spreads (and bull put spreads) before tackling backspreads, as I like to think of backspreads as short vertical spreads that are supplemented by the purchase an extra out-of-the-money option in the time-honored tradition of swinging for the fences with some of the profits from a spread trade.

As I concluded in the column, “In the options world, there are very few trades where you can make money should the underlying shares move sharply in either direction. Backspreads are intriguing in that they have limited risk, unlimited reward (in one direction), and can make money if the underlying moves either up or down.”

Related posts:

A full list of my (18) Barron’s contributions:


Disclosure(s): long XOP and short VXX at time of writing; Livevol and CBOE are advertisers on VIX and More

Tuesday, January 27, 2015

Average Annual Normalized VIX Futures Term Structure, 2004-2014

One graphic I post periodically that never fails to generate a great deal of interest among traders, strategists and other volatility aficionados is my normalized VIX futures term structure graph. From 2008 – 2013, the annual normalized term structure was notable in that almost every year was an outlier in one way or another. For instance, 2012 and 2013 were the two years with the steepest contango in history, while 2008, 2009 and 2011 represent three of the four years (2007 being the fourth) with the flattest term structure.

And 2014? It could not have been more average. If one combines all the years from 2004 to 2014 and creates an “average year” (i.e., the wide gray line on the chart) then 2014 (double blue line) comes closest to that average.

Normalized VIX Futures Term Structure, 2004-2014

[source(s): CBOE, VIX and More]

Note that the terms structure lines are dotted and somewhat wavy for 2004 – 2006, due to the fact that the CBOE did not implement a full complement of consecutive monthly futures until October 2006.

As for 2015, which is not plotted on the graph above, so far it looks quite flat, almost like a cross between 2007 and 2009. It will be interesting to see if this pattern holds for the balance of the year.

Related posts:

Disclosure(s): the CBOE is an advertiser on VIX and More

Tuesday, December 31, 2013

VIX Futures Term Structure in 2013 Looks a Lot Like 2012

This was a very quiet year for the VIX, with the volatility index posting its second narrowest range for the year since 1995, trailing only 2005, when the Greenspan liquidity flood overwhelmed even the mere thought of a meaningful correction.

The graphic below shows the average (mean) normalized term structure for each year since the VIX futures were launched, back in 2004. In normalizing the data, I have set the average front month VIX futures contract to 100 and have expressed the averages of the second through seven months as multiples of the front month.

[source(s): CBOE Futures Exchange (CFE)]

Note that although the VIX futures were launched in 2004, consecutive VIX futures contracts for the first six months were not available until October 2006, hence the dotted lines for these years to reflect the erratic nature of the data. Interestingly, the lower VIX years of 2005 and 2006 did not produce the steep term structure that we saw in 2012 and saw again in 2013. Last year I described the 2012 VIX futures term structure as a statistical outlier, but now that 2013 data is in the books, it may be more appropriate to think about how the markets might have changed in the last two years, with potential causes that range from the VIX ETPs, more interest in trading volatility products, the rise of weekly options and other developments.

In the next few days I will devote a series of posts to analyzing some VIX, volatility and related data for 2013, then as 2014 unfolds I will offer some thoughts on how some of these markets are changing and evolving.

At the very least, I expect to ramp up my posting substantially in 2014, now that I have my investment management business up and running and find it easier to wear multiple hats at the same time.

Happy New Year!

Related posts:

Disclosure(s): none

Sunday, November 3, 2013

The Evolution of the Holiday Effect in VIX Futures

[The following originally appeared in the November 2012 edition of Expiring Monthly: The Option Traders Journal. I thought the contents might be timely in light of the upcoming holiday season.]

With fewer trading days and a historical record that favors an uptick in stocks and a downtick in volatility, the end of the year never fails to present an intriguing set of trading opportunities.

One phenomenon related to the above is something I have labeled the “holiday effect,” which is the tendency of the CBOE Volatility Index (VIX) December futures to trade at a discount to the midpoint of the VIX November and January futures.

This article provides some historical analysis of the holiday effect and analyzes how the holiday effect has been manifest and evolved over the course of the past few years.

Background and Context on the Holiday Effect on the VIX Index

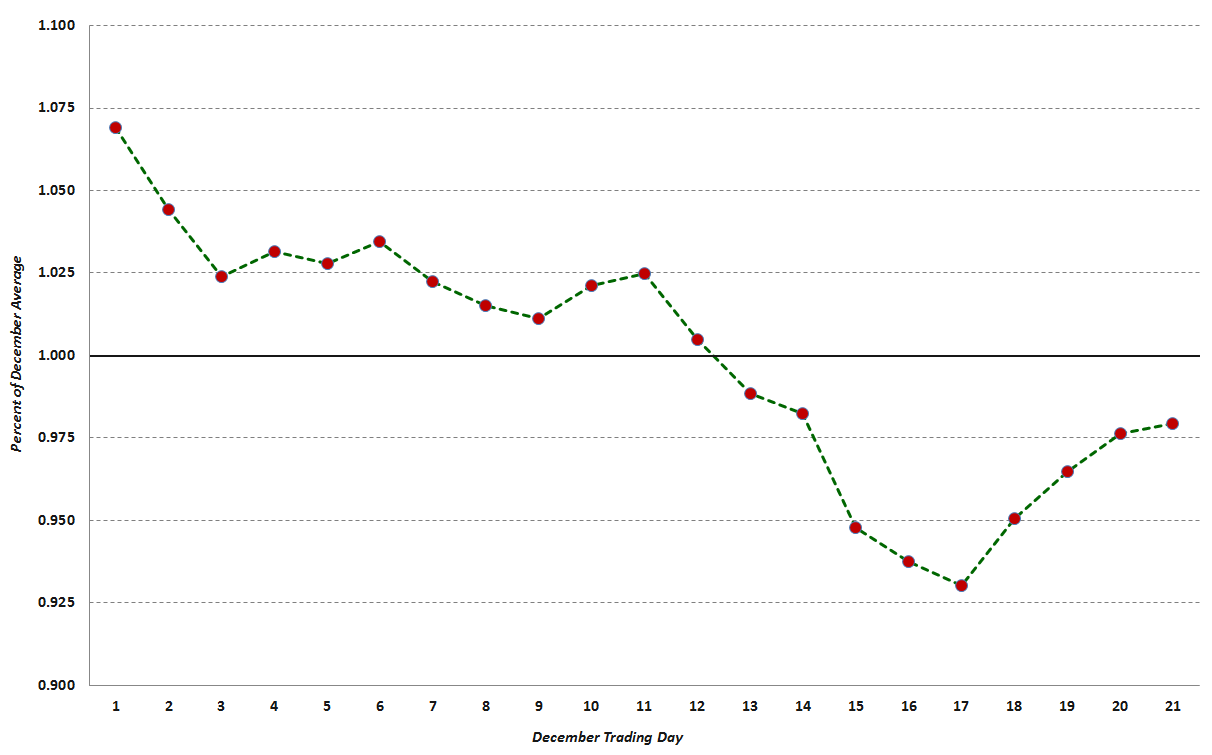
Part of the explanation for the holiday effect is embedded in the historical record. For instance, in eight of the last twenty years, the VIX index has made its annual low during the month of December. In fact, the VIX has demonstrated a marked tendency to decline steadily for the first 17 trading days of the month, as shown below in Figure 1, which uses normalized VIX December data to compare all VIX values for each trading day dating back to 1990. Not surprisingly, those 17 trading days neatly coincide with the typical number of December trading days in advance of the Christmas holiday.

{Figure 1: The Composite December VIX Index, 1990-2011 (source: CBOE Futures Exchange, VIX and More)}

Readers should also note that, on average, the steepest decline in the VIX usually occurs from the middle of the month right up to the Christmas holiday.

The December VIX Futures Angle

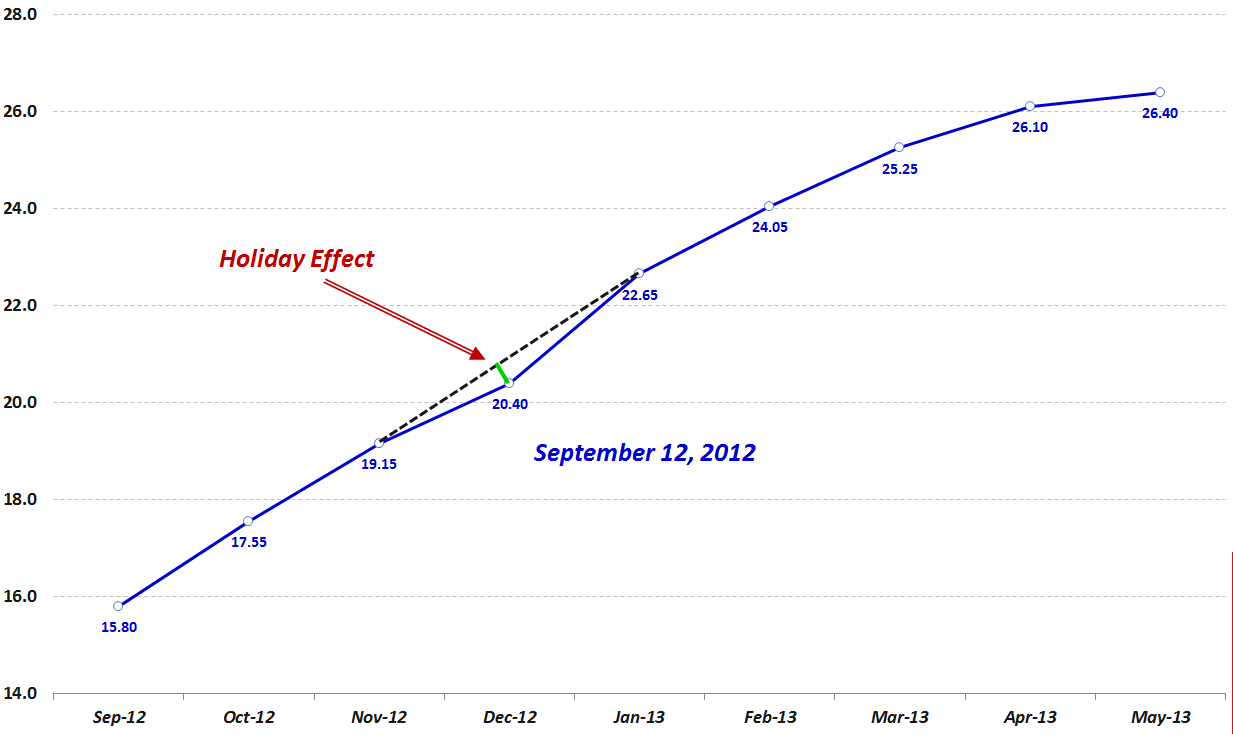
Most VIX traders are aware of the tendency of implied volatility in general and the VIX in particular to decline in December. As a result, since the launch of VIX futures in 2004, there has usually been a noticeable dip in the VIX futures term structure curve for the month of December. Figure 2 below is a snapshot of the VIX futures curve from September 12, 2012. Here I have added a dotted black line to show what a linear interpolation of the December VIX futures would look like, with the green line showing the 0.50 point differential between the actual December VIX futures settlement value of 20.40 on that date and the 20.90 interpolated value, which is derived from the November and January VIX futures contracts. (Apart from the distortions present in the December VIX futures, a linear interpolation utilizing the first and third month VIX futures normally provides an excellent estimate of the value of the second month VIX futures.)

{Figure 2: VIX Futures Curve from September 12, 2012 Showing Holiday Effect (source: CBOE Futures Exchange, VIX and More)}

Looking at the full record of historical data, the mean holiday effect for all days in which the November, December and January futures traded is 1.87%, which means that the December VIX futures have been, on average, 1.87% lower than the value predicted by a linear interpolation of the November and January VIX futures. Further analysis reveals that on 91% of all trading days, the December VIX futures are lower than their November-January interpolated value. The holiday effect, therefore, is persistent and substantial.

The History of the Holiday Effect in the December VIX Futures

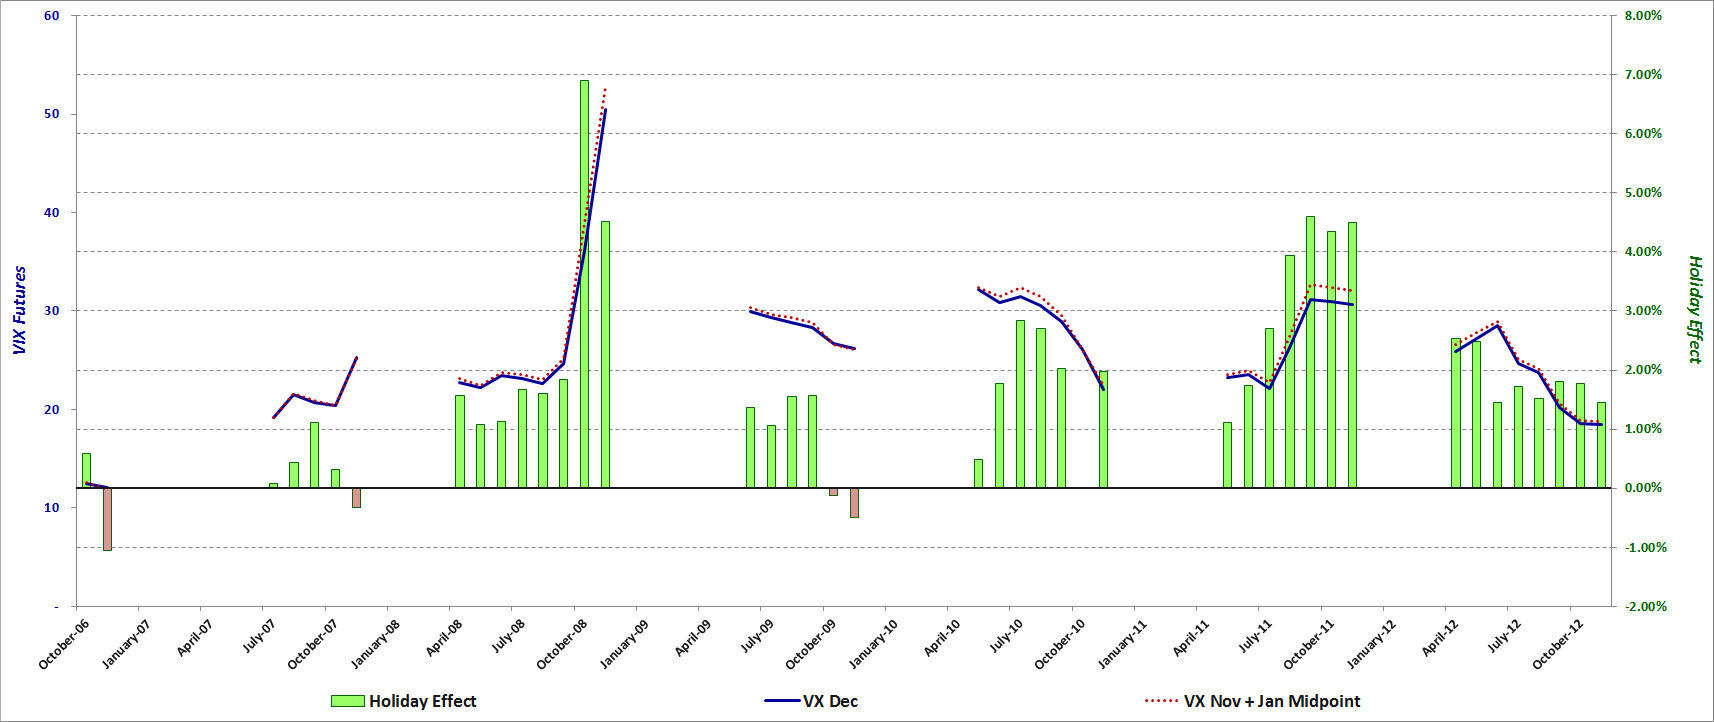
Determining whether the holiday effect is statistically significant is a more daunting task, as there are only six holiday seasons from which one can derive meaningful VIX futures data. Figure 3 shows the monthly average VIX December futures (solid blue line) as well as the midpoint of the November and the January VIX futures (dotted red line) for each month since the VIX futures consecutive contracts were launched in October 2006. Here the green bars represent the magnitude of the holiday effect expressed in percentage terms, with the sign inverted (i.e., a +2% holiday effect means that the VIX December futures would be 2% below the interpolated value derived from November and January futures.)

{Figure 3: VIX December Futures Holiday Effect, 2006-2012 (source: CBOE Futures Exchange, VIX and More)}

Conclusions

With limited data from which to draw conclusions, it is tempting to eyeball the data and look for emerging patterns which may repeat in the future. Clearly one pattern is that an elevated or rising VIX appears to coincide with a larger magnitude holiday effect, whereas a depressed or falling VIX is consistent with a smaller holiday effect. The data is much less compelling when one tries to determine whether the time remaining until the holiday season has an influence on the magnitude of the holiday effect. While one might expect the holiday effect to become magnified later in the season, the evidence to support this hypothesis is scant at this stage.

To sum up, investors have readily accepted that a lower VIX is warranted for December and the downward blip in December for the VIX futures term structure reflects this thinking. As far as whether this seasonal anomaly is tradable, there is still a limited amount of data – not to mention some highly unusual volatility years – from which to develop and back test a robust VIX futures strategy designed to capture the holiday effect.

In terms of trading the holiday effect for the remainder of the year, the coming holiday season is also complicated by matters such as the fiscal cliff deadline and various euro zone milestones that are set for early 2013. In fact, there may not be a reasonable equivalent since the Y2K fears in late 1999 that turned out to be a volatility non-event when the calendar flipped to 2000.

While the opportunities to capitalize on the 2012 holiday effect may be difficult to pinpoint and fleeting, all investors should be attuned to seasonal volatility cycles as 2013 unfolds and volatility expectations ebb and flow with the news cycle as well as the calendar.

Related posts:

Other articles republished from Expiring Monthly:

Disclosure(s): none

Thursday, October 24, 2013

The New VXST and the VXST:VIX Ratio

At the beginning of the month several interesting announcements came out of the CBOE Risk Management Conference in Portugal. One which particularly caught my interest was the announcement of the launch of the new CBOE Short-Term Volatility Index (VXST), which is essentially identical to the VIX, except that whereas the VIX is looking ahead at a window of 30 calendar days, the VXST measures implied volatility of options on the S&P 500 index (SPX) for the next 9 calendar days.

This means that the CBOE now has three different indices to measure implied volatility expectations in SPX options:

  • 9 days (VXST)
  • 30 days (VIX)
  • 93 days (VXV)

The VXV has been a favorite subject of mine going back to my initial comments on the index and the VIX:VXV ratio I pioneered as an indicator back in December 2007. With the new VXST, investors now have a better gauge of volatility expectations to apply to time frames that are appropriate for weekly options, which are on track to account for about 25% of all options trades by the end of the year.

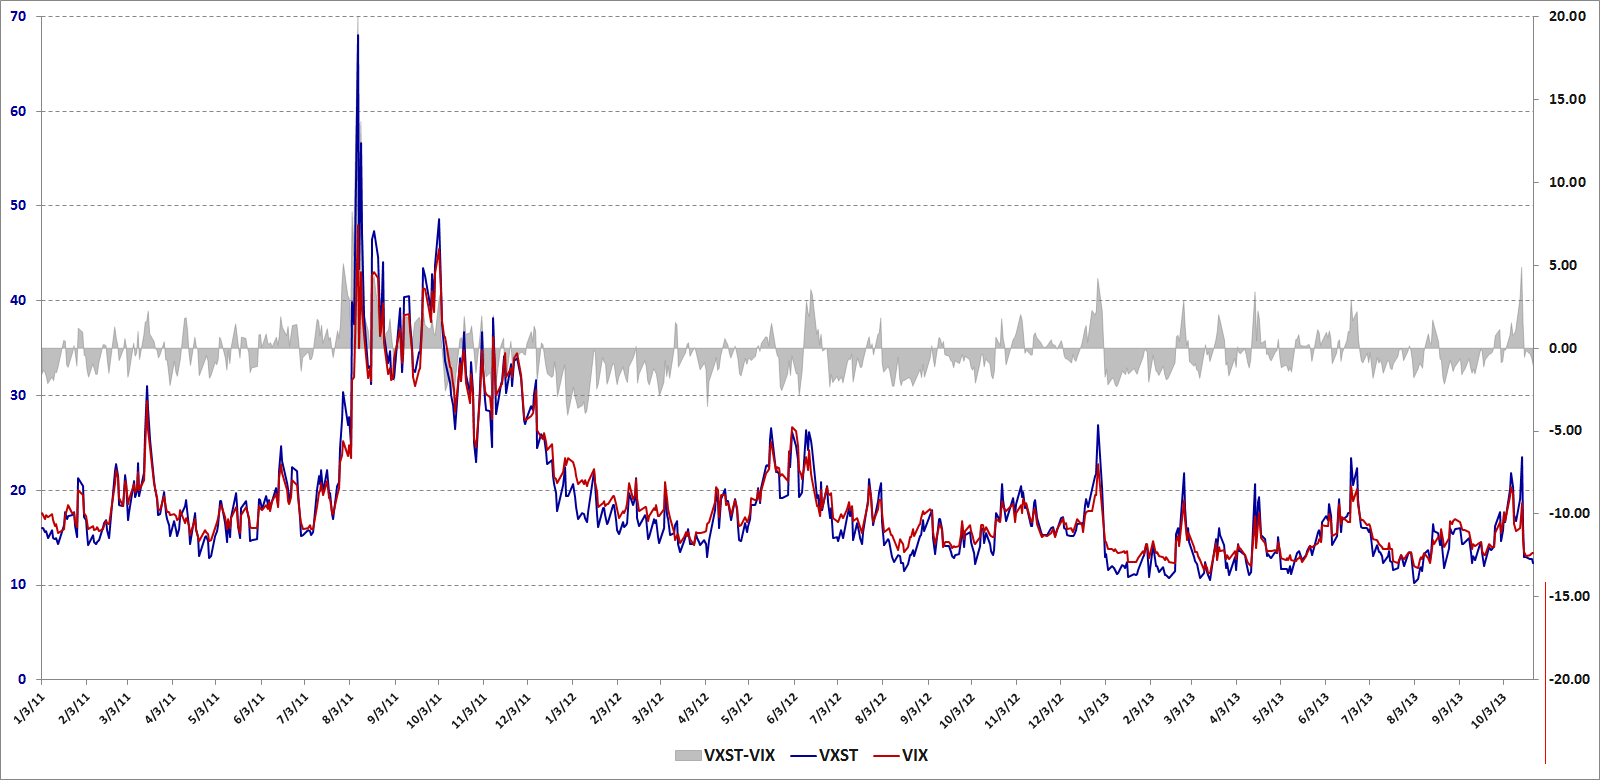
The launch of VXST options opens up a whole new set of possibilities, not the least of which is a VXST:VIX ratio that offers some possibilities as an indicator that are similar to those of the VIX:VXV ratio. In the chart below, I have mapped not the ratio of VXST:VIX, but the differential between the two indices. With VXST historical data going back to the beginning of 2011, it is worth noting that the VIX has been higher than VXST about 61% of the time. Typically, when volatility spikes, VXST spikes much higher than the VIX, with the bulk of the 39% of the instances in which VXST is higher than VIX occurring mostly during periods of elevated volatility.

[source(s): CBOE, VIX and More]

I will go into much greater detail regarding VXST:VIX vs. VIX:VXV at a later point. For now it is worth noting that these ratios have some advantage to comparing the VIX futures term structure in that the indices focus on a fixed time period, while the days to expiration of the VIX futures is constantly in flux.

Also of interest, the CBOE press release notes:

“Plans call for CBOE and CBOE Futures Exchange, LLC (CFE®) to introduce VXST Weeklys options and futures. The launch dates for these tradable VXST products are yet to be determined, pending regulatory approval.”

As compelling as VIX products are for trading, I can imagine that VXST options and futures might be even more attractive to certain types of traders. Also, if VXST futures gain some traction, I can envision ETPs based on these that might rival the interest in VXX at some point.

In other words, this could easily turn out to be a huge development in the volatility space.

Related posts:

Disclosure(s): short VXX at time of writing; the CBOE is an advertiser on VIX and More

Saturday, September 14, 2013

Revisiting the VIX:VXV Ratio

Two of my favorite bloggers, who hail from very different corners of the investment landscape, both happened to mention me in reference to the VIX:VXV ratio in the past few days.

On Wednesday, in A Buy Signal from the Option Market, Cam Hui of Humble Student of the Markets, noted that the VIX:VXV ratio had fallen below 0.92, where “it has provided reasonably good long entry points in the past.” Cam linked back to my first post on the VIX:VXV ratio from December 2007, which, I am fairly certain is the first time anyone ever mentioned the ratio and suggested that it might have some value as a market timing signal.

Today Russell Rhoads of the CBOE, whose Trading VIX Derivatives: Trading and Hedging Strategies Using VIX Futures, Options, and Exchange Traded Notes is undoubtedly the best book ever published on the VIX, also mentioned the VXV:VIX ratio in one of his weekly volatility columns, This Week in VIX Options and ETPs – 9/13/2013. Russell’s version of this ratio, VXV:VIX, flips the numerator and denominator, so his comments are the inverse of much of my analysis. “Note on the chart there are a few instances where the ratio of VXV to VIX falls below 1.0. That seems to coincide with a subsequent near term bottom in the stock market as well.”

I have literally dozens of posts on the VIX:VXV ratio going back to 2007 and while I have hand-picked a selection of posts below that focus on this subject, I could easily fill a book with data, interpretative overlays and trading strategy ideas based on VXV (essentially a 93-day version of the VIX) and its relation to VIX and other measures of volatility.

One of the more interesting issues related to the VIX:VXV ratio is how that ratio has moved up and down over the course of various volatility regimes. In the first two years of the ratio (2007 and 2008), the average (mean) ratio was 0.97 and 1.02; during the past two years, however, the average (mean) ratio has fallen all the way down to 0.87 and 0.90.

For about 1 ½ years following the launch of VXV, using absolute levels in the VIX:VXV ratio as bullish and bearish signals worked almost perfectly. One only has to look at VIX:VXV Ratio Moving Toward Bearish Zone to understand why it quickly gained so many fans. When the 2008 financial crisis hit and in the aftermath of the crisis, the VIX:VXV ratio began to look like just another broken indicator. Since that time, the VIX:VXV ratio has continued to be a very useful indicator, yet its value has been greater when studied in relative terms than absolute terms. Old rules, such as increasing long equity exposure when VIX:VXV fell to 0.92 or 0.90, proved to be of little help when the average of the ratio hovered around 0.90 instead of 1.00.

During the last two years, the VIX futures term structure has departed significantly from historical norms, as I have demonstrated in the likes of The 2012 VIX Futures Term Structure as an Outlier. Frankly, the 2013 version of the VIX futures term structure looks a lot more like the outlier 2012 data set than any previous year.

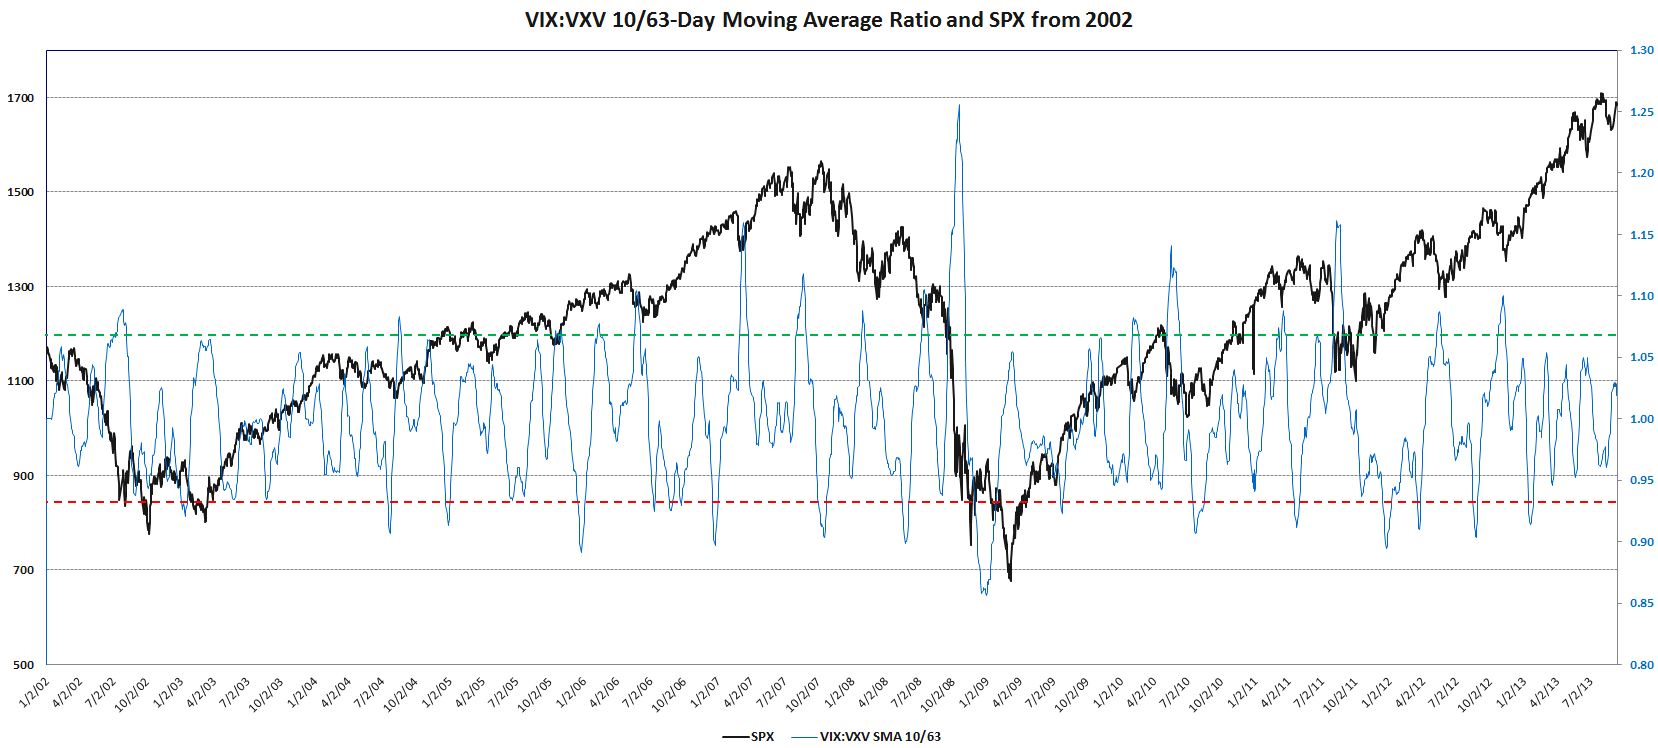
There are many ways to think about a ratio in relative terms. Using percentiles, standard deviations and short-term vs. long-term moving averages are just some of the ways that one can rethink the VIX:VXV ratio in relative terms. In the chart below, for instance, I have calculated the two-week moving average of the VIX:VXV ratio relative to the moving average for the past quarter. This keeps the data standardized around a mean of 1.00 and allows for a way to evaluate the ratio on a relative basis, regardless of whether the current volatility regime has depressed or lifted the ratio data for the full lookback period.  Note how extremes in this ratio of ratios has been an effective market timing signal over the course of the past eleven years.

[source(s): CBOE, VIX and More]

Given the scope of the issues that are related to VXV and the VIX:VXV ratio, I pledge to devote a good deal more space to these issues going forward, including the twists and turns in the VIX futures term structure, the use of the VIX:VXV ratio in determining the dynamic allocations for XVZ, etc.

For those who are doing some of their own research into these and some tangential subjects, the links below are an excellent point of departure.

Related posts:

[source(s): CBOE, Yahoo, VIX and More]

Monday, March 11, 2013

The VIX, Interpolation and the Roll

Almost every month, some subset of the class of investors and journalists expresses extreme alarm when the VIX magically plummets on the Monday before the standard monthly options expiration that occurs on the third Friday of every month.

I have written about this before, notably in:

The executive summary is that for most of its monthly cycle the VIX is an interpolated value derived from the first and second month S&P 500 index (SPX) options contracts. In an interpolation, one is presented with two values and attempts to derive a value that is in between those two, typically by drawing a straight line between the values and attempting to determine where on that line the desired value should fall. When one wants to derive a 30-day VIX and the SPX options contracts are, say, 17 and 45 days out, then a simple linear interpolation accomplishes that goal – and that is what the VIX calculation methodology does.

Things become more interesting due to the fact that the CBOE mandates that the near-term month used in the VIX calculation have at least one week to expiration. So what happens is that on Friday the VIX used the March and April expirations in the VIX calculation; today April becomes the near-term month and May becomes the far-term month. With the April expiration falling on April 19th and the May expiration on May 17th, this means the two months used in the VIX calculation have 39 and 67 days until expiration, respectively. So how does the CBOE arrive at a 30-day VIX value? Well, they still use the near-term VIX calculation (VIN) and far-term VIX calculation (VIF), but they accomplish this task by using a negative coefficient for the weighting of the far-term value, in addition to a coefficient that is greater than 100% for the near-term value.

There is nothing wrong with this approach and it delivers reasonable numbers when the near-term and far-term VIX have roughly the same value, but when there is steep contango in the SPX options term structure, which has frequently been the case over the course of the past two years, the resulting VIX calculation can be dramatically lower than both VIN and VIF. Right now, for instance, the VIX is at 11.71, while VIN is 12.48 and VIF is 13.50.

My suggestion would be not to focus too much attention on the VIX while the calculation uses a negative coefficient for VIF, which will be for the remainder of this week. Instead, those looking for a better gauge of what the VIX is should probably focus on VIN for the next four days.

Alternatively, one can refer to SPX implied volatility calculations provided by their options data provider, such as are incorporated into the SPX skew graphic below, courtesy of LivevolPro.

Related posts:

[source(s): LivevolPro.com]

Disclosure(s): Livevol and the CBOE are advertisers on VIX and More

Monday, January 21, 2013

New Updates for Newsletter and EVALS

This is a quick update to let readers know that I have recently posted detailed updates for the VIX and More Subscriber Newsletter as well as for VIX and More – EVALS, which is essentially a model portfolio based on VIX exchange-traded products that complements the newsletter.

Launched in March 2008, the VIX and More Subscriber Newsletter is published weekly and provides general market commentary, an asset class outlook and an explanation of my current investment thesis, as well as a more detailed analysis of market sentiment, volatility, the VIX futures term structure, and trading opportunities in the volatility space. Over the course of the past year or two, there has been an increased emphasis on various ways to trade the VIX ETPs, including the use of several proprietary indices to evaluate the timeliness of selected trading approaches. One feature that has been popular since the launch of the newsletter is the Stock of the Week. In the Q3 Newsletter Update I discussed the Stock of the Week selection process in some detail; in the recently completed Q4 Newsletter Update, I elaborate on the performance of the Stock of the Week in 2012 (up more than 100%) and also talk about four proprietary indices I use to evaluate the timeliness of selected VIX ETP trading strategies.

VIX and More EVALS was re-launched in November 2011 as a model portfolio that trades the VIX ETPs and a handful of other ETPs with a volatility component. The EVALS Q4 Update details performance data, risk-adjusted performance data, trading data, etc. for a model portfolio that posted a gain of 62% in 2012. Additional information can be gleaned from the EVALS One-Year Summary and Performance Update, as well as previous posts, such as EVALS Relaunches, Now Focusing on VIX Exchange-Traded Products.

In keeping with tradition, my intention is to limit the content related to the newsletter and EVALS in this space and encourage readers who are interested in additional details and subscription information to check out:

Related posts:

Disclosure(s): none

Friday, January 4, 2013

VIX ETP Performance in 2012

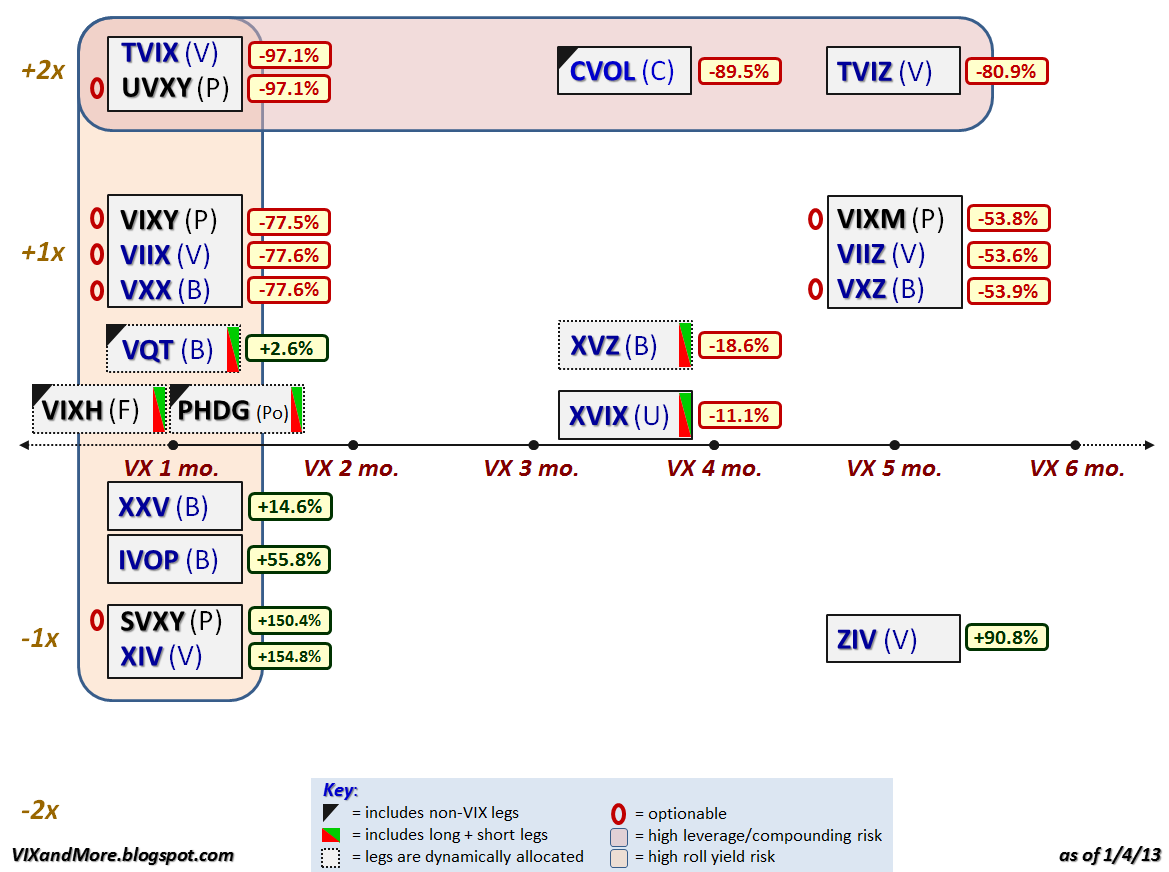
For anyone who pays attention to the VIX exchange-traded products space, 2012 was the year of the inverse (short) VIX futures ETP. The graphic below recaps the performance of the VIX ETPs that were trading as of the end of 2012 and it is easy to see that if you were long the inverse products (XIV, SVXY, ZIV, etc.) and were able to hold on to these positions during volatility storms such as the Greek elections, yield spikes on the sovereign debt of Italy and Spain, the fiscal cliff, etc. (all of which required nerves of steel and a creative risk management approach), then 2012 was a very good year for you. If not, then let the performance ups and downs be a reminder that most of the VIX ETPs are not well-suited for mainstream investors.

Instead of going into too much detail about the performance and reiterating much of what I have already said in the past, I encourage readers to investigate the links below, which include some predictions about future price moves and risk-reward ratios that have been borne out by the events of 2012.

If your new to this product space, perhaps the first place you should begin your research is with posts tagged with labels such as contango, roll yield and term structure – subjects that I have been writing about since the first VIX ETPs were launched, three years ago this month.

[Note that there are no performance numbers for VIXH or PHDG, as these products were launched during the year and have not yet accumulated full-year performance data.]

Related posts:

Disclosure(s): long XIV, SVXY and ZIV at time of writing

Sunday, December 30, 2012

Portfolio Insurance for (Almost) Free

A lot of strange things happened in the financial markets late on Friday afternoon and a good deal of the craziness was in the VIX futures market, with impacts felt in the likes of VXX, which jumped 11.6% in less than an hour (the last 40 minutes of the regular session and the first 14 minutes of after-hours trading.)

The corresponding spike in the VIX futures prices pushed the front two months of the VIX futures term structure into backwardation (a downward sloping term structure curve in which front month futures contract is priced higher than the second month futures contract) for only the second day since November 2011, with the lone exception dating from May 18, 2012, when the front two month contracts were in backwardation by a mere 0.05 points.

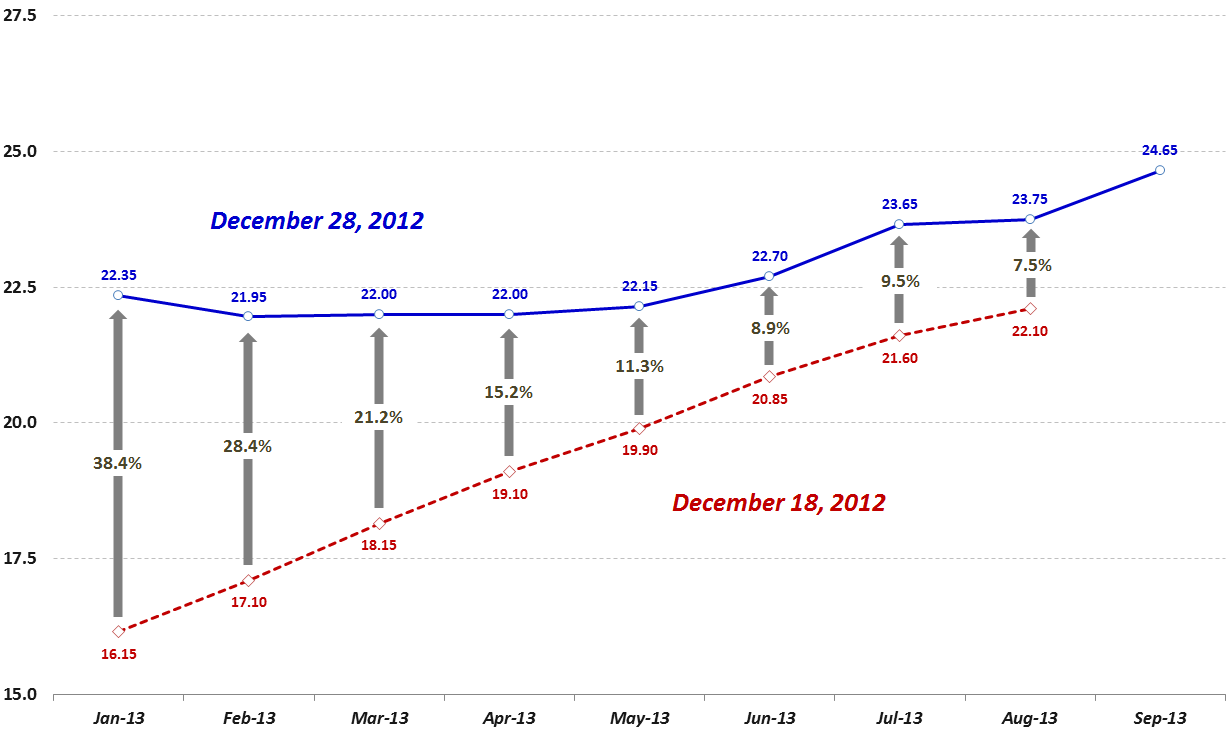
The chart below shows how the VIX futures term structure changed over a ten-day period from December 18 to December 28. While all eight VIX futures contracts that were trading on both dates showed in increase, the magnitude of these increases were skewed dramatically toward the front months, where the January VIX futures contract jumped 38.4%, the February contract gained 28.4%, the March contract rose 21.2%, etc. Also of note, whereas the December 18th term structure was upward sloping in an almost perfect linear fashion, by December 28th the term structure had twisted so that the January contract is now trading at a higher level than the contracts for the February, March, April and May expirations. In fact, the market is now pricing in expectations that a VIX of about 22 will persist for the next five months.

[source(s): CBOE Futures Exchange (CFE)]

With the backwardation in the front two months of the VIX futures contracts, this also means that investors who are looking to hedge long equity exposure against an increase in volatility can now take advantage of what is essentially free portfolio insurance. Of course I am using the “free” label loosely, but given that the short-term VIX futures (first and second month contracts) are in contango (front months less expensive than more distant months) more than 80% of the time and subject to the price decay associated with negative roll yield while in contango, I feel it is important to underscore that the short-term VIX futures roll yield is now positive, meaning that if the VIX January and February contracts do not change in price, the positive roll yield should provide a small lift to VXX, UVXY, TVIX and the other short-term VIX ETPs with a long volatility bias.

Now before anyone gets too excited about the possibility of free portfolio insurance, it is important to understand that the reason the VIX futures are in backwardation is that market participants anticipate that the VIX will decline going forward, making a long volatility hedge of limited value. So while long positions in VXX, UVXY, TVIX and their ilk are benefiting from positive roll yield at the moment, most investors consider that a decline in the VIX and VIX futures is likely to more than compensate for any gains due to roll yield, meaning that these hedges will probably be net losers when one accounts for the changes in the VIX futures and the roll yield.

[Since some of the subjects above have not come up for discussion in a fairly long time, today’s set of links is more comprehensive than usual. As always, these are not arranged in order of significance, but are grouped roughly by subject matter, with some of the more recent posts on the subject toward the top.]

Related posts:

Disclosure(s): short VXX and UVXY at time of writing

Friday, December 7, 2012

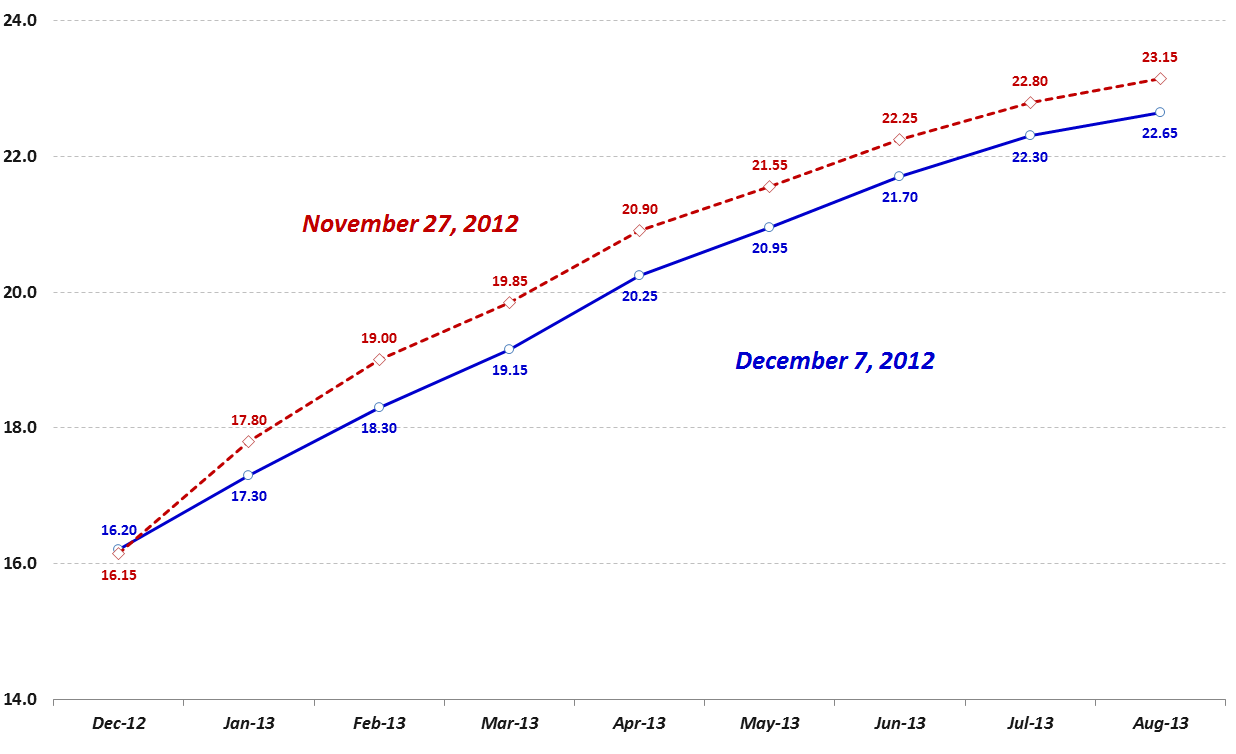
Unusual Twist in VIX Futures Term Structure as of Late

Even with the U.S. fiscal cliff grabbing all the headlines and keeping the VIX from dipping under 15, I still thought I might be able to trot out my annual series of posts on the holiday effect (or calendar reversion):

As it turns out, fears related to the fiscal cliff have trumped the seasonal factors – at least so far – and the VIX futures term structure has twisted and turned in a decidedly unusual manner.

The graphic below shows the VIX futures term structure curve from November 27th (dotted red line) and again today (solid blue line), eight trading days later. Typically when there are changes in the term structure, the most extreme moves are in the front month (Dec) contract, the second largest move is in the second month (Jan) contract and so on down to the back month, which typically moves only about one third as much as the front month.

What makes the graphic below so interesting is that the front month contract is up slightly (actually up 0.05 points) while the market’s estimation of future implied volatility going out all the way to August has dropped at least 2.2% (Jul and Aug) and as much as 3.8% (Feb). What can we conclude about these changes in the VIX futures? Well, most likely investors are buying protection against a move in December (the VIX futures expire at the open on December 19th) and are selling longer-dated VIX futures contracts for February and other months in order to finance the cost of that protection. All things being said, the market is reflecting less risk in 2013, somewhat offset by a slight increase in risk and uncertainty for the next two weeks or so.

[source(s): CBOE Futures Exchange (CFE)]

Related posts:

Disclosure(s): none

DISCLAIMER: "VIX®" is a trademark of Chicago Board Options Exchange, Incorporated. Chicago Board Options Exchange, Incorporated is not affiliated with this website or this website's owner's or operators. CBOE assumes no responsibility for the accuracy or completeness or any other aspect of any content posted on this website by its operator or any third party. All content on this site is provided for informational and entertainment purposes only and is not intended as advice to buy or sell any securities. Stocks are difficult to trade; options are even harder. When it comes to VIX derivatives, don't fall into the trap of thinking that just because you can ride a horse, you can ride an alligator. Please do your own homework and accept full responsibility for any investment decisions you make. No content on this site can be used for commercial purposes without the prior written permission of the author. Copyright © 2007-2023 Bill Luby. All rights reserved.
 
Web Analytics