EVALS Details Performance Data for First Year
For the most part, I try to keep information about the VIX and More Subscriber Newsletter and EVALS to an absolute minimum in this space, but lately EVALS has become such a phenomenon that I decided it would be easier to discuss it here rather than to continue to the answer the large volume of questions about this service that inevitably clog up my inbox.
In keeping with tradition, I will touch up on a couple of highlights here and recommend that readers who are interested in more information visit the EVALS blog and start with today’s post, EVALS One Year Summary and Performance Update (+74.13%).
Since November 17, 2011, EVALS has been focusing entirely on VIX and volatility-based ETPs. In the first year of operation, the EVALS model portfolio traded 12 different VIX and volatility-based ETPs a total of 81 times. Some 63.6% of all closed trades were winners and the average winner gained 5.4 times as much as the average loser lost, with a median holding period of 60 days.
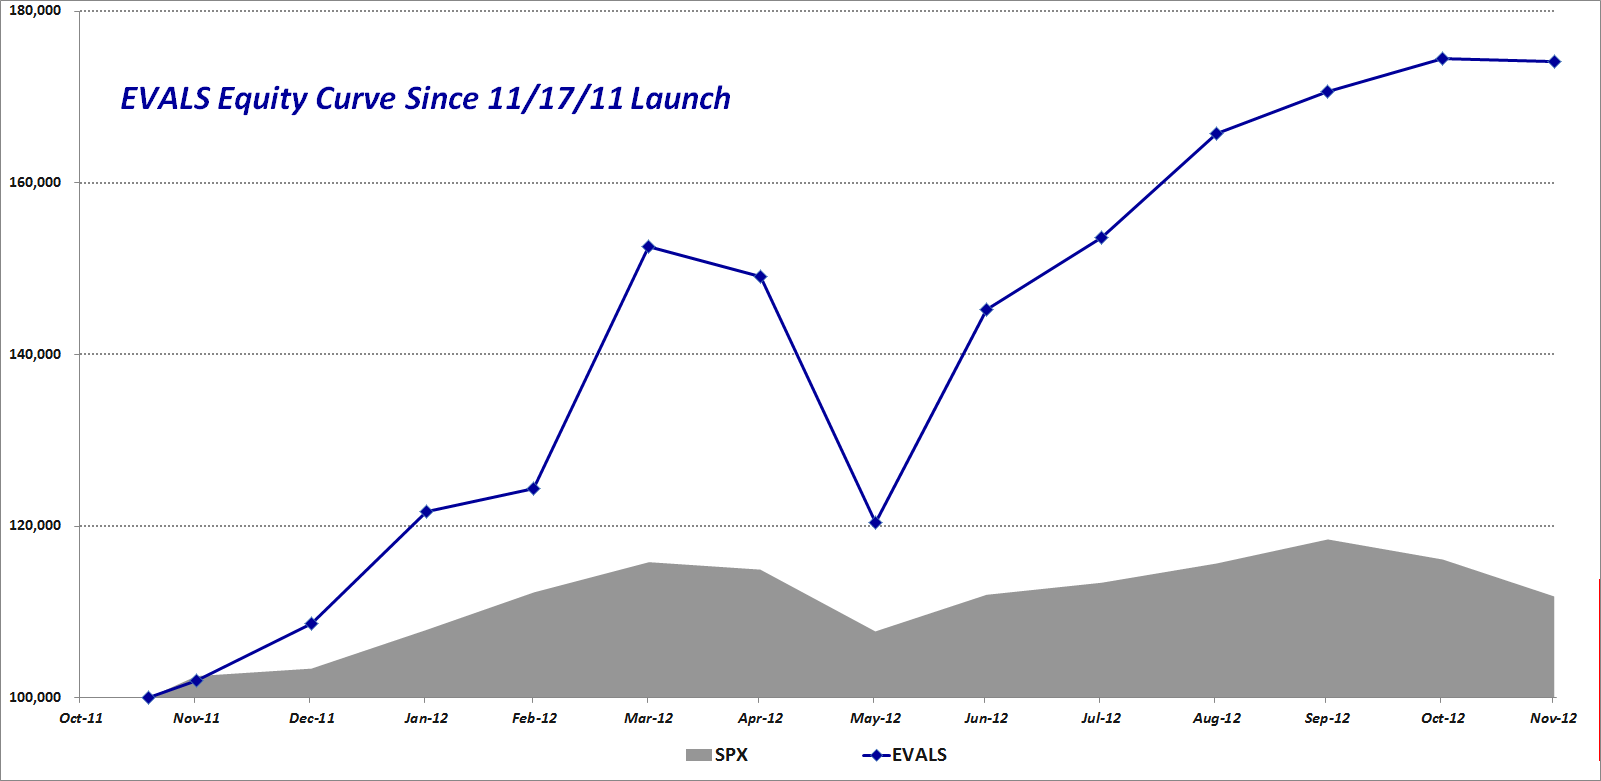
For those with an interest in risk-adjusted performance metrics, EVALS had a Sharpe ratio of 1.65 in the first year, a Sortino ratio of 2.39 and a Schwager Gain to Pain ratio of 2.91. More information and performance data can be found on the EVALS blog. Also of interest may be the following equity curve, which shows the one-year performance of a hypothetical model portfolio consisting of $100,000 that was invested in EVALS and the S&P 500 on the November 17, 2011 launch date.

Finally, for anyone who may be confused about what content is in EVALS, what is in the newsletter and what finds its way to the blog, I have updated what I call the content pyramid, which hopefully will be (mostly) self-explanatory.

Related posts (from the EVALS blog):
- EVALS One Year Summary and Performance Update (+74.13%)
- EVALS Relaunches, Now Focusing on VIX Exchange-Traded Products
Disclosure(s): none

