VIX Exchange-Traded Products: The Year in Review, 2011
The year is not quite over, but I can safely predict that it when it is in the books, there will be no doubt that 2011 has been a bull market for VIX exchange-traded products (ETPs). After seeing two VIX ETPs launched in 2009 and ten in 2010, this year has witnessed the launch of 20 VIX ETPs.
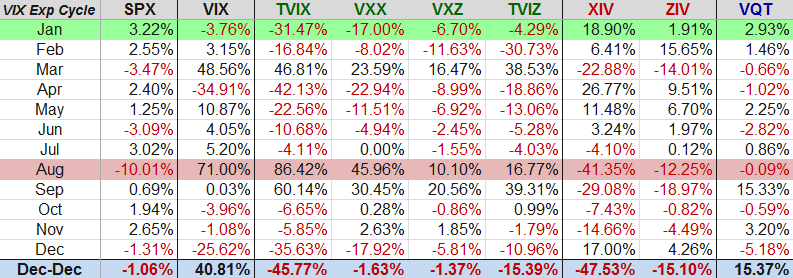
In the week ahead I will provide some commentary about the evolution of VIX ETPs in 2011 and what to look for in 2012, but for now I wanted to share a performance table for a cross-section of VIX ETPs that were open for the full year.
Before I touch upon on the graphic below, I wanted first to comment on the time periods used for the performance data. Now perhaps my life is too complicated, as it seems I have to simultaneously sync it to three different calendars: the standard Gregorian calendar, the options expiration calendar (particularly the standard Friday monthly and weekly expirations) and the VIX options expiration calendar (featuring VIX options and futures expiration on those Wednesdays highlighted by purple squares in the preceding link.) The graphic below uses the VIX options expiration cycle, specifically measuring from Tuesday’s close immediately before VIX options expiration to the next Tuesday’s close just prior to VIX options expiration the following month. This means that the January 2011 entry includes the full VIX options expiration cycle for that month: December 22, 2010 – January 18, 201. This also means the most recent December 2011 data covers the full December VIX options expiration cycle: November 16, 2011 – December 20, 2011.
In the graphic below, I have highlighted the best performing (VIX expiration cycle) month for the SPX in green and the worst performing month in red. Note that over the course of the full year (December 22, 2010 – December 20, 2011) each of the VIX ETPs (long volatility in green and short volatility in red) managed to lose value, even though the VIX was up over 40% during that period. The one exception is VQT, which consists largely of a SPY position, with a dynamic allocation of VXX that ranges from 2.5% to 40% of the ETPs holdings. [For more information on VQT, refer to The Case for VQT and Barclays VEQTOR ETN (VQT) Begins Trading.]
While it is interesting that both the long and short volatility ETPs were unable to turn a profit for the year, there were stretches during 2011 that various VIX ETPs produced extraordinary gains.
As promised, I will delve more into the performance of the universe of VIX ETPs and their suitability as speculative and hedging plays before the end of the year and in the weeks and months ahead.
Related posts:
- Slicing and Dicing All 31 Flavors of the VIX ETPs
- The Case for VQT
- Barclays VEQTOR ETN (VQT) Begins Trading
- High and Low Volatility ETPs
- Now Sixteen Volatility ETPs, Four of Which Are Optionable
- Two More VIX ETNs Make it a Baker’s Dozen
- Impressive Launch for Sextet of New Volatility ETNs from VelocityShares
- VelocityShares Jumping in to VIX ETP Space with Leveraged and Inverse Products
- The Evolving VIX ETN Landscape
- Interesting New Leveraged Volatility ETN Coming from Citi
- Shorting VXX and Long XXV or XIV
Disclosure(s): long XIV, ZIV and VQT; short TVIX and VXX at time of writing

