How Good Has the U.S. Data Been Lately?
At some point investors are going to have to change their watches back from Central European Time to Eastern Time (or Central Time if you are an options trader) and pay more attention to what is going on inside the borders of that sometimes overlooked nation just south of Canada.
Whenever that time comes, the first question on the agenda on the minds of most investors will be whether the relatively robust economic performance (at least by current global standards) will be able to continue. Earlier this week, in Global Manufacturing Recession or Noise? EconomPic raised the question of whether the U.S. and a handful of emerging market economies would be able to lift the global economy up or whether Europe and the Pacific Rim nations would end up dragging down those few economies that are currently thriving.
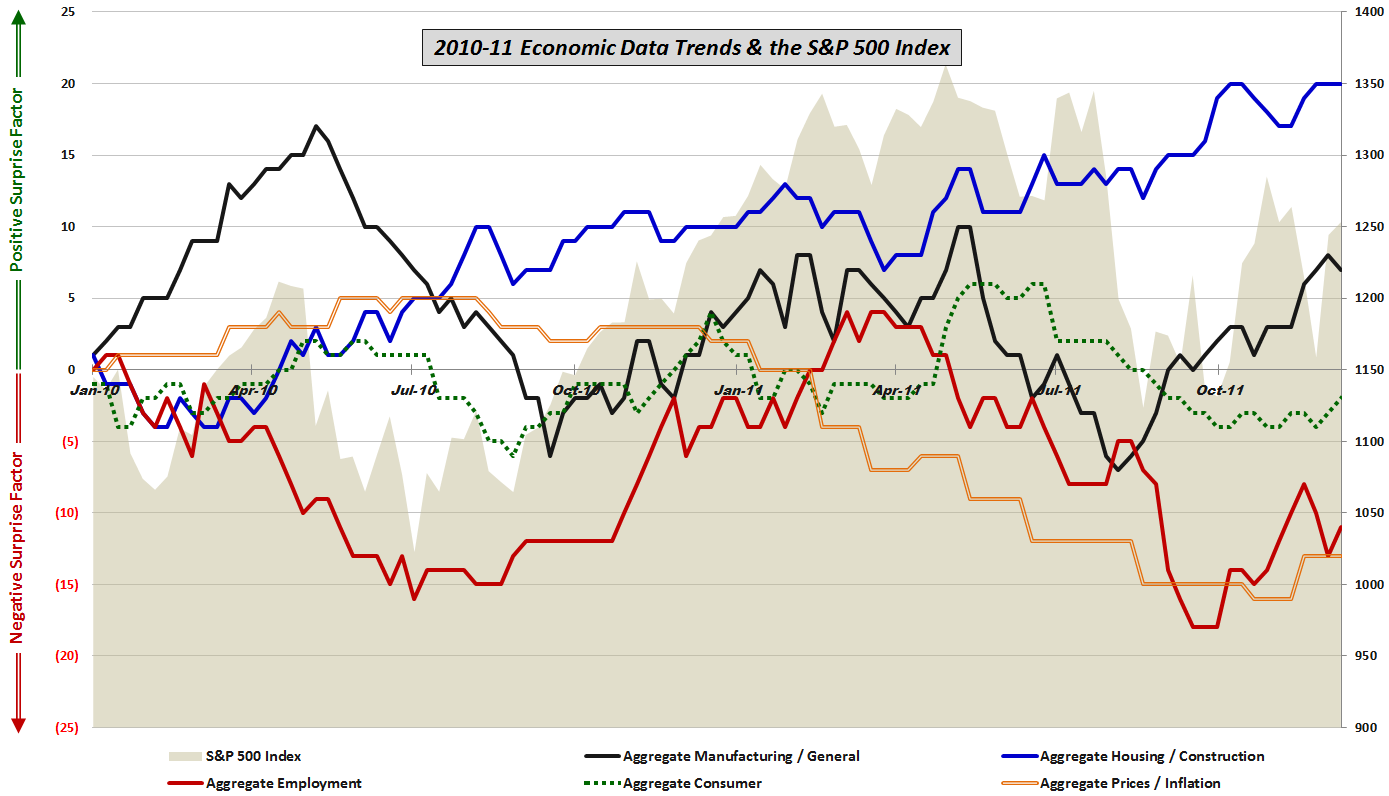
I do not have an answer to that question at this point in time, but I do believe the answers are most likely to come out of U.S. economic performance relative to expectations, which I have been tracking in some detail for the past two years. The graphic below shows how the United States has been faring relative to expectations in five groups (manufacturing/general, housing/construction, employment, consumer and prices/inflation) since the beginning of 2010.
The graphic below shows a definite upturn in positive surprises across all categories during the past 2-4 months. Should these trends continue, it bodes well for global activity and for stock prices as well – especially if the European disaster discount can be marked down.
Readers who are interested in more information on the details of the economic data included in this graphic and the methodology used are encouraged to check out the links below. For those seeking more details on the specific economic data releases which are part of my aggregate data calculations, check out Chart of the Week: The Year in Economic Data (2010).
Related posts:
- Economic Data Not Supporting Gloom and Doom Forecasts – At Least for Now
- Economic Data Relative to Expectations and Stock Prices
- Continued Lackluster Data vs. Expectations
- Economic Data Frozen Until Next Thursday
- More Upticks in Economic Data vs. Expectations
- Economic Data Trends Improving
- Chart of the Week: Updated Economic Data Trends
- Economic Data Trends in Advance of Nonfarm Payrolls
- Trends in Economic Data Relative to Expectations
Disclosure(s): none
[sources: various]

