Aggregate View of U.S. Data vs. Expectations
Yesterday I posed and (to some extent) answered the question, How Good Has the U.S. Data Been Lately?
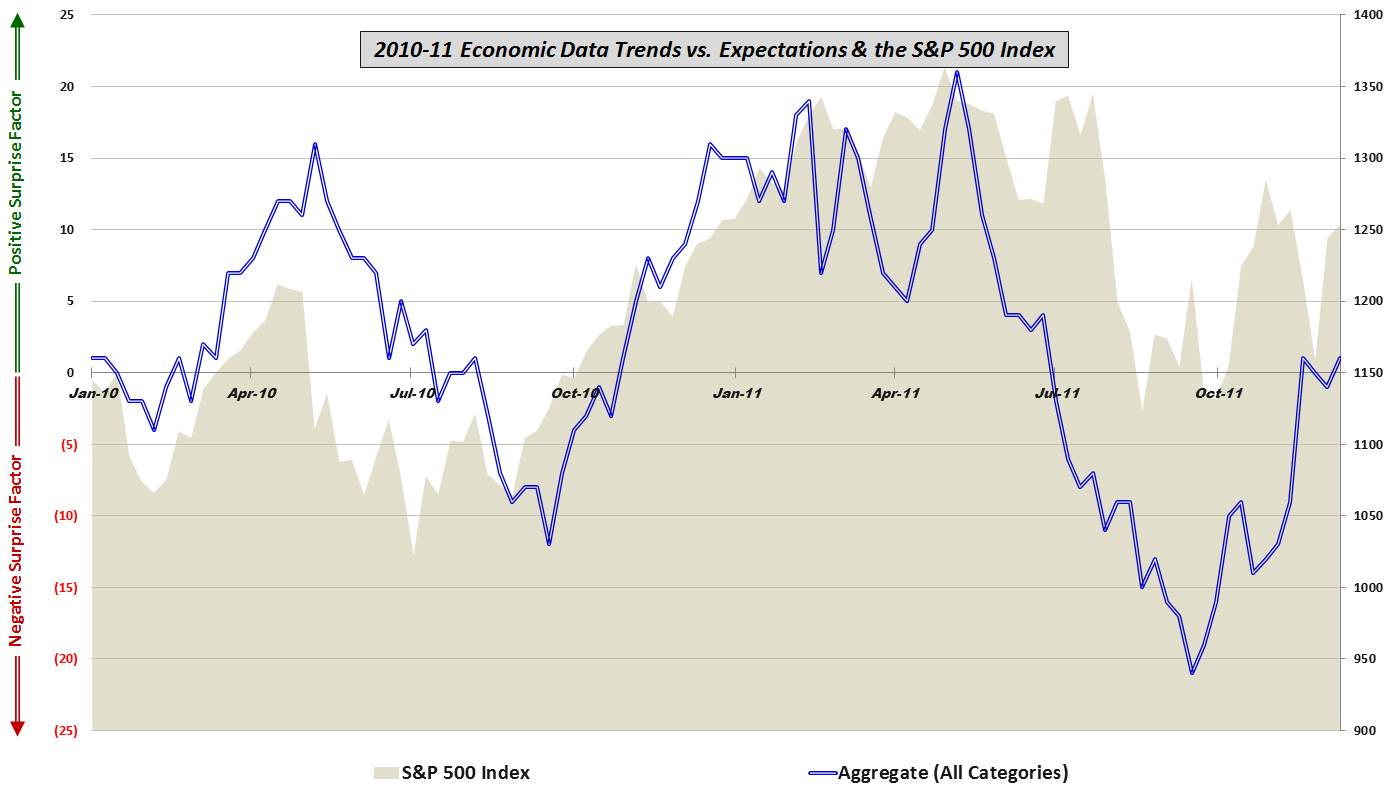
Today I have aggregated the performance relative to expectations across five groups of economic activity (manufacturing/general, housing/construction, employment, consumer and prices/inflation) and present those data and the S&P 500 index for the past two years.
As the graphic below shows, both the data and the SPX has retraced about half of the decline since the late April (stocks) to early May (economic data) peaks.
Looking at the chart, one could certainly make the case that data underperformed stocks from April to September, but has been outperforming stocks for the last 2 ½ months.
While conventional wisdom says that stocks lead economic fundamentals for 6-9 months, this graphic does not support that idea. Instead, it will be interesting to see which of the two assumes a leading role now that at least some of the European angst appears to be in the rear view mirror.
[Readers who are interested in more information on the component data included in this graphic and the methodology used are encouraged to check out the links below. For those seeking more details on the specific economic data releases which are part of my aggregate data calculations, check out Chart of the Week: The Year in Economic Data (2010).]
Related posts:
- How Good Has the U.S. Data Been Lately?
- Economic Data Not Supporting Gloom and Doom Forecasts – At Least for Now
- Economic Data Relative to Expectations and Stock Prices
- Continued Lackluster Data vs. Expectations
- Economic Data Frozen Until Next Thursday
- More Upticks in Economic Data vs. Expectations
- Economic Data Trends Improving
- Chart of the Week: Updated Economic Data Trends
- Economic Data Trends in Advance of Nonfarm Payrolls
- Trends in Economic Data Relative to Expectations
Disclosure(s): none
[sources: various]

