Showing posts with label options expiration. Show all posts

Friday, December 23, 2011

VIX Exchange-Traded Products: The Year in Review, 2011

The year is not quite over, but I can safely predict that it when it is in the books, there will be no doubt that 2011 has been a bull market for VIX exchange-traded products (ETPs). After seeing two VIX ETPs launched in 2009 and ten in 2010, this year has witnessed the launch of 20 VIX ETPs.

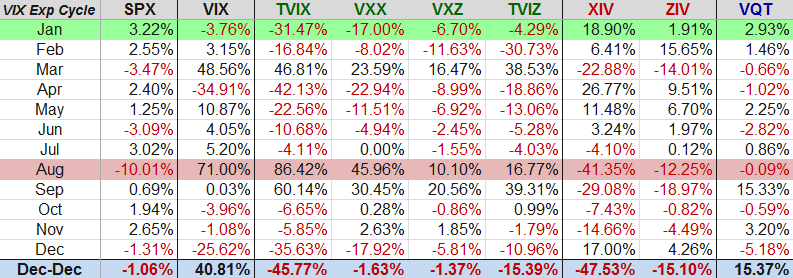
In the week ahead I will provide some commentary about the evolution of VIX ETPs in 2011 and what to look for in 2012, but for now I wanted to share a performance table for a cross-section of VIX ETPs that were open for the full year.

Before I touch upon on the graphic below, I wanted first to comment on the time periods used for the performance data. Now perhaps my life is too complicated, as it seems I have to simultaneously sync it to three different calendars: the standard Gregorian calendar, the options expiration calendar (particularly the standard Friday monthly and weekly expirations) and the VIX options expiration calendar (featuring VIX options and futures expiration on those Wednesdays highlighted by purple squares in the preceding link.) The graphic below uses the VIX options expiration cycle, specifically measuring from Tuesday’s close immediately before VIX options expiration to the next Tuesday’s close just prior to VIX options expiration the following month. This means that the January 2011 entry includes the full VIX options expiration cycle for that month: December 22, 2010 – January 18, 201. This also means the most recent December 2011 data covers the full December VIX options expiration cycle: November 16, 2011 – December 20, 2011.

In the graphic below, I have highlighted the best performing (VIX expiration cycle) month for the SPX in green and the worst performing month in red. Note that over the course of the full year (December 22, 2010 – December 20, 2011) each of the VIX ETPs (long volatility in green and short volatility in red) managed to lose value, even though the VIX was up over 40% during that period. The one exception is VQT, which consists largely of a SPY position, with a dynamic allocation of VXX that ranges from 2.5% to 40% of the ETPs holdings. [For more information on VQT, refer to The Case for VQT and Barclays VEQTOR ETN (VQT) Begins Trading.]

While it is interesting that both the long and short volatility ETPs were unable to turn a profit for the year, there were stretches during 2011 that various VIX ETPs produced extraordinary gains.

As promised, I will delve more into the performance of the universe of VIX ETPs and their suitability as speculative and hedging plays before the end of the year and in the weeks and months ahead.

Related posts:

Disclosure(s): long XIV, ZIV and VQT; short TVIX and VXX at time of writing

Friday, August 12, 2011

The Convergence of VIX and VIX Futures at Expiration

VIX futures and options expire 30 days prior to the expiration of options in the S&P 500 index for the following month. With the September SPX options expiration set for September 16th, this means that August VIX options will expire on next Wednesday, August 17th.

Students of the VIX (and there seem to be many when the VIX spikes over 40) should all know that over the course of their life, VIX options are not priced off of the VIX index. Instead, the best approximations for the appropriate underlying for VIX options are the corresponding VIX futures. The one caveat is that at expiration, the VIX index and VIX futures must converge on a single price for the VIX. This price convergence in the VIX and VIX front month futures is always interesting to watch, but particularly so in high volatility environments.

The mechanics of the VIX settlement process are non-trivial, but suffice it to say that they settle with a Special Opening Quotation (SOQ) at Wednesday’s open, based upon opening trades (as well as the midpoint between the bid and ask) in SPX options. As a result, the last opportunity to trade VIX August futures and options is the session before the SOQ, at Tuesday’s close.

With two full trading days plus 1 ½ hours of today’s session left, there is a substantial discrepancy between the VIX and the VIX futures. As I type this, the VIX is at 36.40 and the August VIX futures are at 34.50. Somehow that gap needs to be closed in the next two days. Right now the market’s best guess is that the VIX will fall 1.90 points by Wednesday’s SOQ, but of course the final settlement could be between the two current values and quite possible above 36.40 or below 34.50. If you are trading any of these instruments, you should be aware of the price gap and the path of the convergence. You might also use this opportunity to brush up on the little-known near-term month VIX index (VIN) by checking out VIN, VIF and an Obsolete VIX.

Related posts:

Disclosure(s): Short VIX at time of writing

Monday, November 23, 2009

SPX Strangle Pong Post-Mortem

When I first broached the idea of Strangle Pong (a strategy of selling a front month strangle in the SPX one leg at a time), I had every intention of periodically following up to offer comments on the strategy, how it was or was not working, and how a trader might manage a position like the one discussed in order to minimize risk while realizing a large amount of the profit potential.

In Strangle Pong Update, Mark Wolfinger (Options for Rookies) and I discussed the advisability of closing out the short put trade and taking some rather substantial profits. We agreed that keeping the position open in hopes of securing the final 3.65 in profit was not an attractive risk-reward play, particularly since the position had already earned 20.35 in profits. I concluded, however, that “for educational purposes I will opt to keep this an open item on the blog.” When I made that comment, I did not realize that an upcoming trip to Hawaii (the Big Island, where everyone who has an opportunity to do so should ignore the cost and take the helicopter tour of Kilauea) would keep me off the communications grid. What I am left with at this juncture is not the real-time analysis that I had hoped for, but a post-mortem. Usually I would not think a post-mortem would be as instructive, but in this case, I think there are quite a few lessons to learn.

For starters, while it turns out that my original rationale for the trade was rewarded at expiration, the risks along the way did not warrant holding through expiration, at least for me. This is an important point for beginning options traders, who have a tendency to hold their winning and losing options trades through expiration, usually resulting in winning trades giving back some of their earlier profits and all too often losing trades expiring worthless.

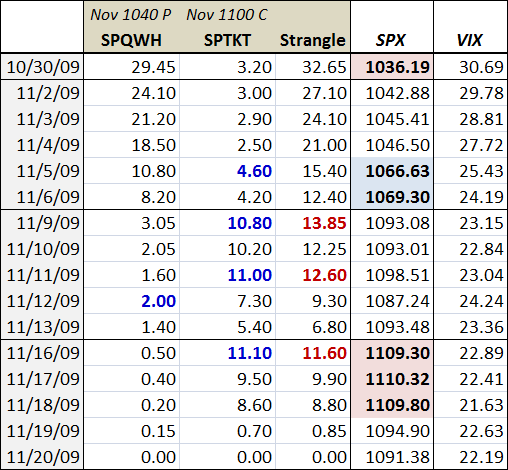
To recap, the idea behind the short strangle was to capitalize on the possibility of range-bound trading in the SPX in the 1040-1100 area during the last 16 days of the expiration cycle. The objective was to leg into the trade based on which end of the range the SPX was trading. The first leg was a short November SPX 1040 put that immediately went in the wrong direction. As the table below shows, the SPX broke 1040 and closed at 1036 and change (red shading) on the day the trade was initiated. With a maximum gain of 24 points, the trade was already a 5.45 point loss at the end of the first day. More importantly, a critical part of the trade thesis – that 1040 would provide support – was no longer valid. The bottom line is that there was very good reason to cut losses on day one and close out the trade.

As it turns out, my market timing signals earned their keep the next day as buyers jumped in, with support coming in the 1029-1030 area and the SPX beginning an almost uninterrupted bullish run for the next 13 trading days. After 5-6 days, the SPX had recovered to the middle of the target 1040-1100 trading range (blue shading) and two thirds of the potential profit had already been realized.

The week prior to expiration saw the SPX take a run at 1100 and just fall short. During that week, the 1040 puts fell all the way down to 1.40, while the November 1100 calls moved up in price on Monday and Wednesday (bold blue type). The short 1100 call position that Mark and I discarded as too risky on Monday at 8.40 would have been a loser from Monday through Thursday. While the short 1100 call eventually became profitable on Friday, the following week the SPX broke out over 1100 and closed near 1110 on Monday, Tuesday and Wednesday, with the calls still unprofitable and threatening to incur larger losses.

Getting back to the original rationale for the trade, once the SPX closed above 1100 on Monday, upside resistance was broken and the risk was too high for a relatively small reward. At that stage – and with only four days remaining prior to expiration, I would have closed the trade at a loss of 3.20.

So to recap, while this looks like a perfect short strangle on paper, with both the short put and the short call expiring worthless, prudent risk management would not have resulted in holding the trade until expiration. Further, not only would the profits on the short put have been taken early (netting 20.35 out of a possible 24.00), but if the short call leg had been initiated (and I thought this was a questionable trade at the time of the Strangle Pong Update), I would certainly have cut my losses (-3.20) before giving the trade a chance to make a profit.

The bottom line is that this was a great trade on paper, but with proper risk management, is was merely a very good trade in terms of profits, netting only about 60% of what would have been earned if the strangle had been held to expiration. Over the long run, however, I maintain that understanding the risk-reward profiles of existing options positions is more important than trying to extract the maximum profit from each options trade.

For the two previous posts in this series, readers are encouraged to check out:

Friday, August 21, 2009

Options Expiration Weeks and the March to August Bull Market

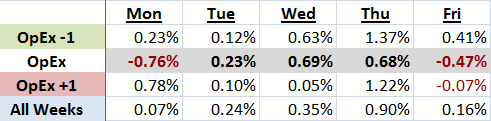
For a number of reasons, the options expiration cycle can be extremely difficult to trade. One of the problems with options expiration week is that the forces acting on stock prices are often much different this week than during other weeks, often ignoring underlying existing trends, but sometimes magnifying them.

A good rule of thumb is that the week before options expiration is most likely to be bullish and the week after options expiration is most likely to be bearish. On average, options expiration week is less volatile and more directionally neutral than these other two weeks.

In the table below, I looked at data since the March 6th low and found it interesting that the week before options expiration has been the most bullish of the three expiration weeks, with the week after options expiration the second most bullish, by a small margin. Options expiration week itself has been relatively flat, particularly when compared to the other two weeks.

My knee-jerk explanation for this is that stock movements during options expiration week are more likely to be random and out of synch with underlying trends. As a result, during options expiration week, stocks frequently underperform in bull markets and outperform in bear markets.

For some related posts, try:

Friday, July 17, 2009

Trading Options Expiration Days

I had just about decided to stop trading options expiration days when I read Jeff Augen’s Trading Options at Expiration: Strategies and Models for Winning the Endgame (see Another Winner from Jeff Augen for more details), which inspired me to consider a number of potential new options expiration strategies.

As a trader, I am acutely aware that my aggregate P&L for options expiration days is a net loss. It is not just the fact that I have always found it difficult to be consistently profitable on options expiration days that has bothered me, but it has also been the frustration of seemingly having to maintain one set of rules for 240 trading days per year and another set of rules to deal with a completely different set of opportunities and hurdles presented once each month.

The bottom line for me is that it is not worth it to day trade options expirations days and let’s face it, who doesn’t need an extra day off each month. Further, why bother with the day before FOMC announcements, when trading is typically lackadaisical at best? With options expirations every month and FOMC meetings every six weeks, this means 20 additional vacation days a year – perhaps even paid for by cutting trading losses.

I encourage every trader to check their track record on options expirations days and FOMC announcements days to see whether they should be entitled to 20 extra vacation days. Don’t stop at these two slices, perhaps your strategies do not work well on the day before holidays, the week after options expiration, the first week of each month, Wednesdays (crude oil inventories), Thursdays (jobless claims), the day you have dental appointments or whatever.

Not all days are created equal and if your edge isn’t there on certain days, perhaps you should not just step away from the keyboard, but hop in the car and go have some fun with all the money you are saving.


[A number of readers have asked where I took this photo. It is from Battle Rock Beach at Port Orford, Oregon. I took this particular shot on a bluff overlooking the beach. Later on I discovered that a local B&B just happened to have a webcam with a similar perspective: Battle Rock Beach webcam]

Tuesday, June 16, 2009

Selling VIX Puts Pre-Expiration

Selling naked puts on the VIX just prior to expiration can be a surprisingly low risk volatility play.

Normally, selling naked puts is a dangerous strategy because of the risk that negative news can overwhelm the underlying, causing it to gap down and create a large loss. With the VIX, however, spikes are almost always upward, because while threats to equities are relatively easy to identify, it is much more difficult to discern when these threats are suddenly extinguished.

For this reason – and because the VIX has lately shown some reluctance to drop below the recent floor of 27 – selling a naked put on the VIX is a lot less risky than selling naked puts on other securities. Risk to the down side is definitely limited, yet the limitations are not perfectly mathematically quantifiable.

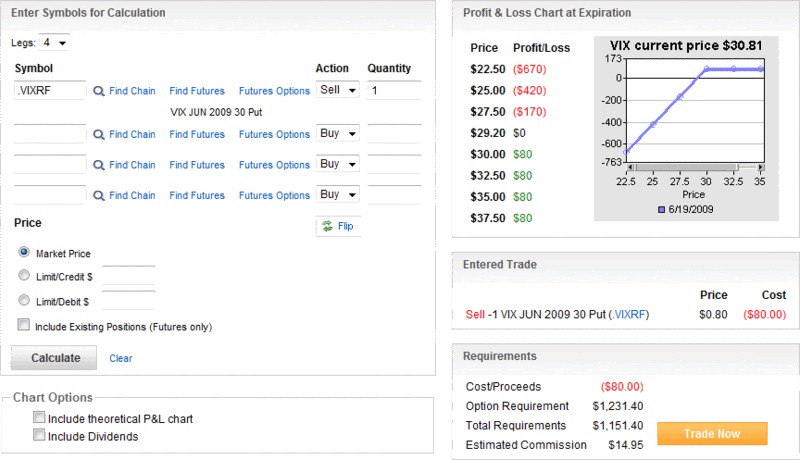
A sale of the June 30 put illustrates one potential naked put sale opportunity. The profit and loss chart below outlines what the trade looks like. With yesterday’s closing price of 30.81, the trade is profitable if the VIX rises, drifts sideways or loses up to 1.61 prior to tomorrow's special opening quotation. The gain is $80 per contract. The profit and loss chart shows that a loss of $170 per contract occurs at 27.50. Assuming 27.00 is a floor in the VIX, then the maximum loss is likely to be capped at $220. While a 12.3% drop in the VIX in one day cannot be ruled out, it is obviously not a very likely scenario.

Reminder: VIX options expire on Wednesdays. The June VIX options expire June 17th this cycle. The last trading day for these options is today, Tuesday, June 16rd. (See the 2009 options expiration calendar for more the full 2009 options expiration schedule.)

[source: optionsXpress]

Disclosure: Neutral position in VIX via options at time of writing.

Tuesday, May 12, 2009

Another Winner from Jeff Augen

While I never got around to a formal review, I did give Jeff Augen’s The Volatility Edge in Options Trading: New Technical Strategies for Investing in Unstable Markets a Best New Volatility Book award in the VIX and More 2008 Volatility Awards. I thought that book did an excellent job in providing new insights in how to trade the earnings cycle and the options expiration cycle.

I recently had the chance to read Augen’s latest book, Trading Options at Expiration: Strategies and Models for Winning the Endgame and once again had a very favorable reaction. This time around Augen focuses almost entirely on the last two days of the options expiration cycle and offers up some interesting ideas and trading strategies to take advantage of anomalies in time decay and implied volatility.

Augen’s new book does not have the heft of the original, but the focus is one of the book’s strengths.

If you are like me, you probably find the last two days of the options expiration cycle to be among the most difficult periods to trade. After reading Trading Options at Expiration, I guarantee (and how many guarantees are there in the investing world?) that you will look at the end of options expiration week differently and see more opportunities than pitfalls.

With three days until the end of the current options expiration cycle, now is as good a time as any to start evaluating some new strategic approaches.

Tuesday, April 14, 2009

VIX Expiration Straddles

With less than an hour left before today’s trading session comes to a close and the April VIX options can no longer be traded, this seems like as good a time as any to mention a pure overnight volatility gamble: the VIX expiration straddle.

I have difficulty calling this trade anything other than a speculative gamble and am certainly not recommending it, but there are some who love this type of trade.

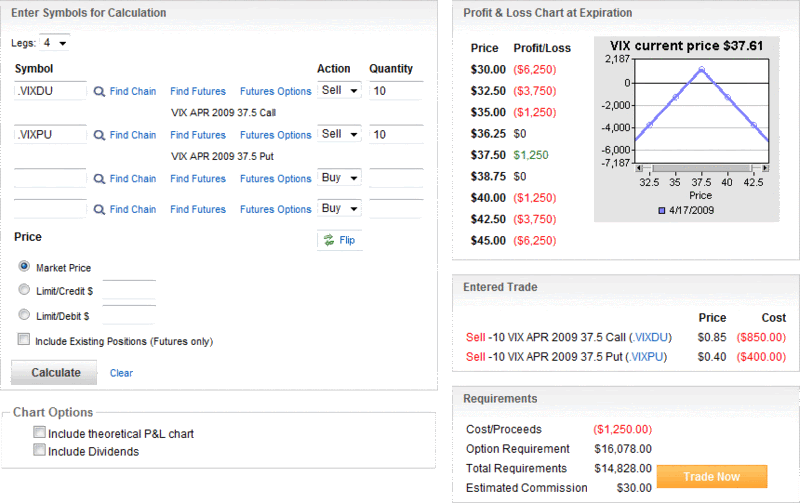
As outlined in the optionsXpress graphic below, the VIX is at 37.61 as I type this, just 0.11 above the 37.50 strike. In the example indicated in the graphic, selling 10 April VIX 37.50 calls and 10 April VIX 37.50 puts nets $1250. If the VIX settles at tomorrow’s opening at 37.50, this is the maximum gain. As the profit and loss table shows, break even is at 36.25 and 38.75. A loss comparable to the maximum profit of $1250 will be realized at 35.00 and 40.00. If the VIX settles below 35.00 or above 40.00, then the losses will be even more significant. For long positions, the numbers are reversed.

That is pretty much the trade in a nutshell.

Anyone making this trade should be aware that there are several important economic releases before the open tomorrow, including the March CPI data, March industrial production and capacity utilization, and several others. In addition, there is a fairly large slate of earnings due out after the close today and before the open tomorrow. In short, a lot can happen overnight.

Still…if you think the VIX will settle between 36.25 and 38.75, a VIX short straddle is one way to put that idea into action.

It is also important to keep in mind that most options players who are looking to make this trade will likely be doing so several weeks before expiration and close the position out prior to the last trading day...but there are others like like the overnight approach.

For two related VIX expiration options plays, check out:

[source: optionsXpress]

Monday, March 16, 2009

VIX Expiration Condors

A quick reminder for anyone holding VIX options or contemplating VIX options trades in the next day or two that the last day of trading for VIX March options is tomorrow. VIX options expire on Wednesday, with settlement at the open of trading for SPX options on Wednesday morning. For those that have not done so already, I recommend bookmarking the OCC options expiration calendar, which I have included as a permanent link in the right hand column of the blog.

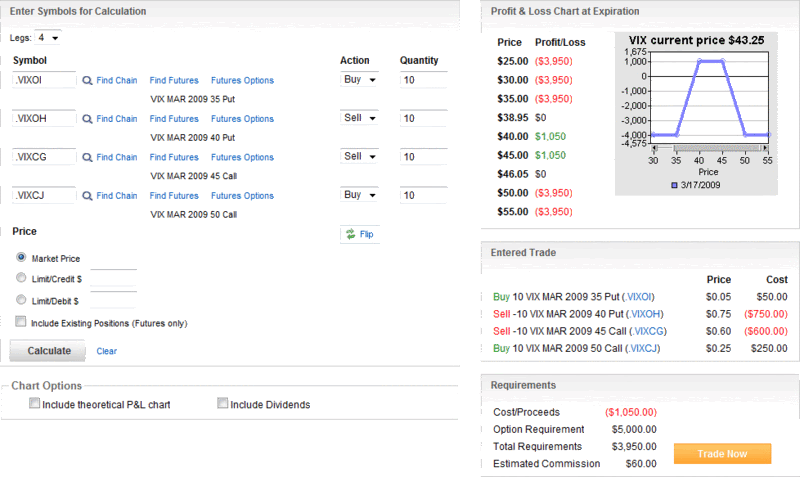
As VIX options expiration approaches, I am reminded of one trader who likes to go long iron condors, usually on Monday or Tuesday, in a bet that the VIX will be relatively quiet prior to expiration. The iron condor trade is very similar to A VIX Butterfly Play, which I described last month (see also Follow Up to “A VIX Butterfly Play”), with one exception that the condors have a wider maximum profit zone, but smaller maximum upside. There are some other practical differences between a butterfly and condor as well, notably that the condors are less likely to require follow-up position adjustments and additional commissions. Perhaps more germane to the trade above, it is sometimes appropriate to let condor trades run to expiration, but this is rarely a desirable approach for butterflies.

The chart below outlines a VIX iron condor trade, with data from optionsXpress this morning. I call these pre-expiration trades “expiration condors.”

For more information on iron condors and a broad range of excellent options-related content, I recommend visiting Condor Options.

[source: optionsXpress]

Wednesday, February 18, 2009

Follow Up to “A VIX Butterfly Play”

Someone asked me to explain how the VIX options trade I outlined yesterday in A VIX Butterfly Play turned out. I will try to keep the explanation short.

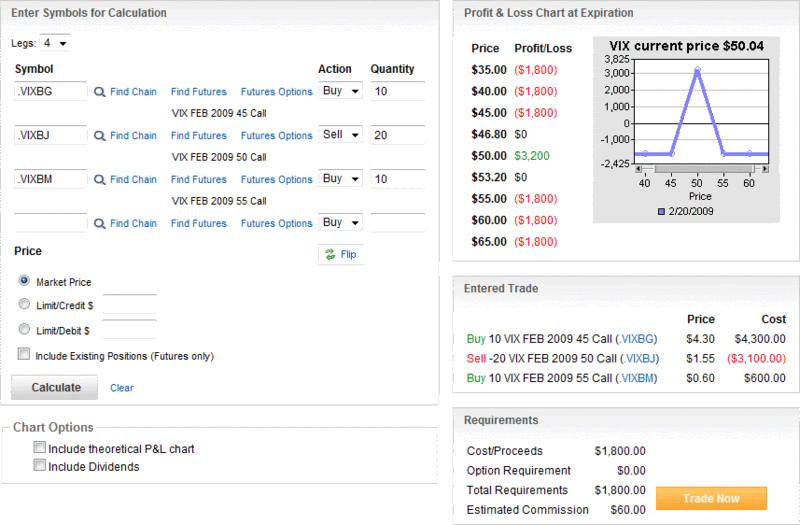
The original trade, which I described yesterday morning when the VIX was trading at 50.04, was as follows:

  • long 10 VIX Feb 45 calls
  • short 20 VIX Feb 50 calls
  • long 10 VIX Feb 55 calls

To review, yesterday was the last trading day in VIX February options and today the VIX February contract exercise-settlement value was fixed at a special opening quotation (SOQ) of the VIX that was based off of the SPX March options series. Today’s SOQ (ticker VRO) was 48.40, which was 0.26 below yesterday's VIX close.

[Note that the reason the VIX has its own options expiration calendar is that VIX options settle 30 days prior to the options expiration date for SPX options in the subsequent month.]

To summarize, the profit zone for this trade was a VIX of 46.80 - 53.20, with the trade breaking even at the extremes of the range. The maximum profit was at a VIX of 50.00.

With a 10/20/10 position, the maximum potential profit for this trade was $3200; the maximum potential loss (with a VIX either at 45 or below or at 55 or above) was $1800. At 48.40, the VIX just happened to close exactly halfway between the maximum gain and the break even area. As a result, the trade gained half of the maximum potential profit, or $1600. Of course these profit and loss numbers are based on a position involving 40 calls (10/20/10). I consider that to be a 10 unit trade. With the accounting on an individual unit basis (long 1, short 2, long 1), the profit would have been $160 per unit.

In one sense, this type of trade is a pure gamble on volatility, but when volatility is unusually high, as it was last night, the profit zone can be large enough to make it a positive expectation trade, depending on one's forecast of overnight volatility.

Tuesday, February 17, 2009

A VIX Butterfly Play

I usually shy away from generating trade ideas, but here is a gamble that I know at least one trader is sure to be taking today: a VIX pre-expiration butterfly.

The butterfly trade highlighted below is for illustrative purposes only, but should explain the approach. The idea is simple. This butterfly trade will make a profit if the special opening quotation (SOQ) for the VIX is between 46.80 and 53.20 – about 6.4% in either direction from the current VIX level of about 50. In other words, if the VIX falls in a 12.8% band around the current price, the trade makes money.

Of course a lot can happen with the VIX in less than a day, but in terms of trading, there are about 3 ½ hours left in today’s session. Before tomorrow’s open, there are several important economic reports, including January building permits and housing starts, as well as January industrial production and capacity utilization. If those reports don’t bring the end of the world any nearer than it is now – or indicate that all the economic problems are suddenly solved – then the VIX butterfly trade should be in good shape.

Note that the maximum loss is about 56% of the potential maximum gain, which will happen if the VIX SOQ is ‘pinned’ at 50 tomorrow morning.

[source: optionsXpress]

Friday, January 16, 2009

VIX January Options as Short-Term Portfolio Protection

I know that very few retail traders actively trade VIX options, but for those who usually do not consider this product, I want to highlight the fact that because the VIX expiration calendar is different from the standard third Friday of the month equity and index expiration calendar, this weekend might be an appropriate time to think about VIX options as a short-term portfolio protection play.

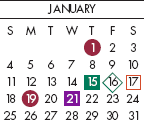
Anyone who has portfolio insurance in the form of options expiring tomorrow is likely concerned about what will happen over the long weekend, particularly with rumors about the possibility of Citigroup (C) and Bank of America (BAC) being nationalized. One solution, of course, is to roll those January options into February and beyond. If, however, you do not necessarily want to buy portfolio protection for a full month, then you can get it through Wednesday morning with the January VIX options. The last trading date for January VIX options is Tuesday, January 20th, with the options settled at the open on Wednesday morning.

Equity futures have been trending up over night, but substantial short-term risks remain, with all the uncertainty over the financials, compounded by a three day weekend, followed by the inauguration of Barack Obama coming up on Tuesday. I am not going so far as to recommend the purchase of VIX calls, but I do want to make sure that investors with a short-term horizon are aware of the VIX options expiration calendar anomaly.

[graphic: Options Industry Council]

Thursday, January 1, 2009

2008 Volatility Awards

I thought I’d spare everyone a silly sounding name like “the VIXies,” so without further ado, here are the highly subjective and not-otherwise-nicknamed VIX and More volatility awards for 2008:

I’m sure I overlooked some other obvious awards. Feel free to add to this list in the comments section.

Thursday, February 14, 2008

BIDU, Calls and Time Decay

I am generally not a fan of being long any options during options expiration week, as the effort required to ‘salmon’ upstream against the relentless current of time decay (theta) makes these trades extremely challenging. Not only do you have to get the direction right, but you have to do it in a big way and in a hurry. Of course, if there is another volatility event that you have to overcome during options expiration week, that makes the task even more difficult.

Baidu (BIDU) is a perfect case in point. Earnings came out after the close last night and while the most recent quarter comfortably exceeded expectations, the company’s tepid guidance had some analysts wondering what the future revenue stream looks like.

With the conflicting numbers and multiple interpretations available, the market action has been interesting to watch. After closing at 261.09 yesterday, BIDU traded up almost 30 points in the after hours session last night, before settling back to an after hours gain of about 18 points. In pre-market the stock gradually slid down to 274, up about 13 points over Wednesday’s close. When the regular session opened, the stock fell quickly to 263, recovered sharply to trade briefly above 280, and has been in a downtrend ever since, currently trading back down to about 267.

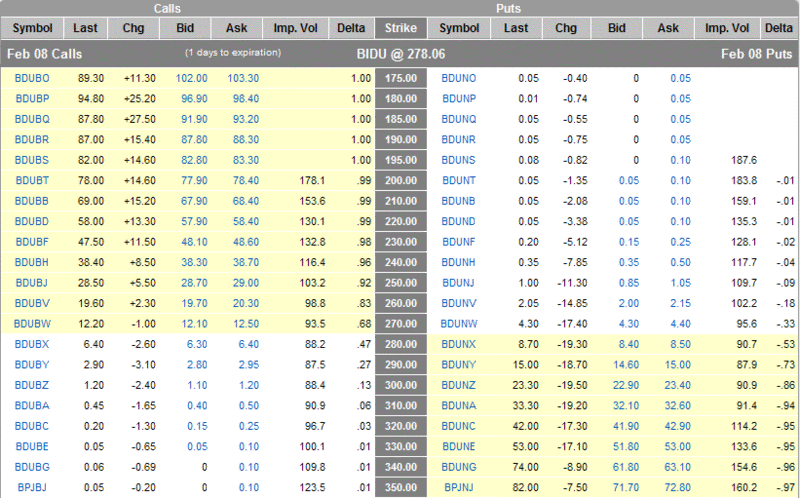
The first graphic, which comes from optionsXpress, shows how the options were behaving after about a half hour of trading, when BIDU was up 16.97 at 278.06. If you happened to be long BIDU calls at a strike of 270 or above, you were losing money, even with the stock up 6.5%.

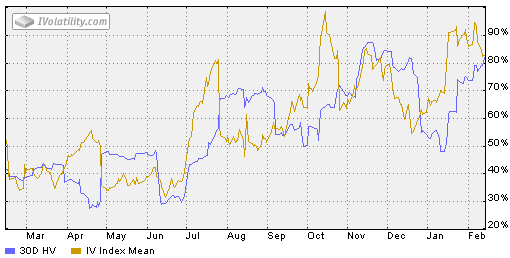
Normally, one would expect a post-earnings volatility crush, where IV contracts and all options lose their value, but as the iVolatility chart on the bottom shows, IV was not particularly high (relative to recent historical BIDU levels) coming into earnings, nor did it drop dramatically after earnings were out (see the IV numbers in the optionsXpress table.)

BIDU’s action today is an excellent illustration of what happens toward the end of the options expiration cycle, when time decay accelerates. While it is still possible to make money being long options, the percentages are with those who are on the side of time decay. If you are looking at a stock with high IV and an earnings report or other volatility event, consider that at the money options can still be losers even if you get the direction correct and have a 6.5% move in the underlying on your side.


Wednesday, February 13, 2008

VIX February Options Calendar Anomaly

Just a quick note to remind anyone who is trading VIX options that the February options expirations calendar [which is pinned at the bottom of the "VIX & Sentiment Links" in the upper right hand corner of the blog] has some unusual features that are the result of the timing of Good Friday, which falls on expiration week in March this year.

Without getting into all the details, the bottom line is that the expiration day for February's VIX options is Tuesday, February 19th, instead of the usual Wednesday. With the President’s Day holiday falling on Monday the 18th, this moves the last trading day in VIX options up to Friday, February 15th – the day after tomorrow. Note that the same expiration and last trading dates also apply to VXN and RVX options.

Anyone who wishes to dive into the details of the VIX options calendar and other related information is encouraged to brush up on the VIX options contract specifications.

Wednesday, September 12, 2007

The VIX and the Fed

Since nobody was reading this blog when I first posted about the VIX and FOMC meetings, I thought I might use next week’s highly anticipated FOMC meeting as an excuse to flag some research I published earlier in the year.
Perhaps the most important piece of information on the VIX and the Fed is a study I have placed in the Archive Highlights section of the blog with the title “VIX Price Movement Around FOMC Meetings.” If you follow the link, you can see why the odds favor a substantial volatility contraction on Tuesday, when the results of the meeting are announced, as well as another smaller volatility contraction on Wednesday, after the information has been digested overnight.

While I am on the subject of the Fed and Archive Highlights, I would be remiss in not pointing out what I consider to be the best set of links on the Fed available on the internet, which I have archived in “Fed Links.”

One other blog link is worth flagging here, the rather innocuous sounding “Options Expiration Calendar,” which resides in the VIX and Sentiment Links section in the upper right hand corner. The reason I mention this link is to remind all interested parties that one of the idiosyncrasies of VIX options is that they do not expire on the third Friday of every month, like equity, index and many other options. Instead, 9 months of the year VIX options expire on the Wednesday after the third Friday of the month; 3 months of the year they expire on the Wednesday before the third Friday of the month – right in the middle of options expiration week. As you can see in the calendar linked above, this early VIX options expiration pattern happens at the end of each quarter in March, June, September and December. This means that VIX options expire the day after next week’s big FOMC meeting, with a special opening quotation (more on this another time.) Even more important, the last day for trading these VIX options is the day before they expire. So anyone holding VIX September options will have exactly 1:45 following the Fed’s announcement to close out their positions. Given the high expectations going into the Fed meeting, it will be very interesting to watch the VIX action – as well as the action on the VIX September options.

So while Tuesday will be a particularly busy day for me, remember that you don’t have to play unless the odds are in your favor. When in doubt, get neutral and watch the action for free from the sidelines.

Friday, June 1, 2007

VIX and the Monthly Calendar

Early on in the life of this blog, when it looked as if volatility were dead and no one cared about the subject, I sliced and diced a bunch of VIX data in good ol’ Excel in an effort to identify some cycles that affect the VIX. Some of the results were particularly intriguing (the annual cycle and the FOMC cycle, for instance) and others were decidedly less enlightening.

One cycle I never got around to publishing the data for is the monthly trading calendar. The quarterly cycle and the options expiration cycle touch a little bit on the monthly cycle, but rather than interpolate at 30,000 feet, I think it is time to look at the monthly cycle more closely.

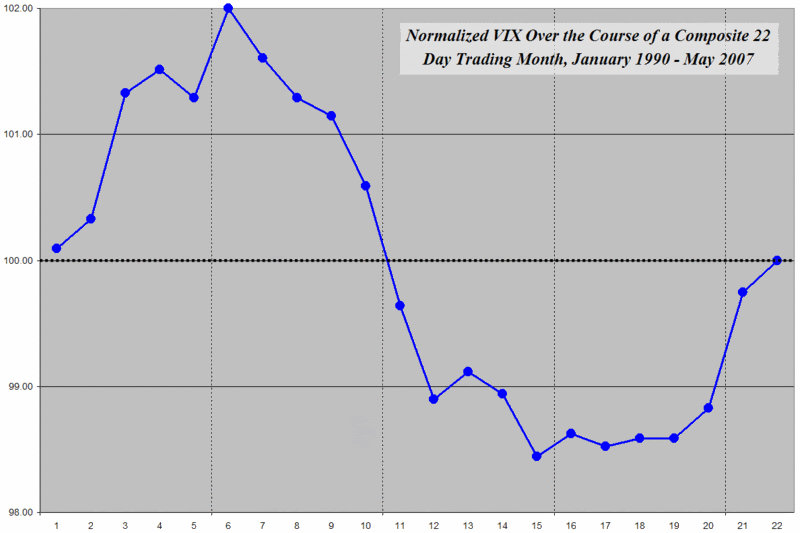
For those who may not be familiar with these charts, the graphic below translates a calendar month into a 22 day trading month, normalizes the VIX at 100, then aggregates VIX closing values for all the trading days from 1990 through yesterday. (I like to normalize the VIX in these graphs because it makes it easier to get a perspective on the magnitude of changes from point to point.)

From previous research on the options expiration cycle, I was not surprised by the dramatic fall in volatility for the week and a half or so prior to options expiration (which averages out to be the 13th trading day of each month.) I was, however, surprised to see the uptick in volatility at the end of each month that tends to run through the 6th trading day of the month. Given that the pattern of bullish moves in the markets at the end and the beginning of each month has been well documented by the likes of the Stock Trader’s Almanac and others, I was not expecting to see that the VIX tends to rise at the same time that the markets generally do the same. I have not yet developed a theory to explain this phenomenon, though I did present Bernie Schaeffer's theory a couple of months ago. As always, I encourage readers to offer their thoughts.

Finally, for those who may be interested in reviewing VIX price movements in the context of some other cycles mentioned previously on this blog, here is a short list of links to investigate:
With enough epicycles, perhaps I can eventually come up with a Ptolemaic approximation of the VIX…

Friday, April 27, 2007

The VIX on Mondays After Options Expiration

A reader asked me what usually happens to the VIX on the Monday following options expiration.
The short answer is that since 1990, the VIX has risen an average of 2.9% on the Monday after options expiration. Looking at all five days of the week, the VIX has posted a mean daily increase of 0.16% since 1990. If you back out those Mondays following options expiration, however, the remaining increase is a mere 0.02% per day, meaning that these post-expiration Mondays have accounted for almost all of the cumulative upside movement in the VIX over the past 17 years.

For what it’s worth, I also looked at the subset of Mondays following quadruple witching days and determined that those results were statistically identical to the other post-expiration Mondays.

One statistic that I found particularly interesting is that 80% of the VIX gains on typical post-expiration Mondays and 90% of the gains following quadruple witching expirations are, on average, reversed in the course of the next three days. So the next time you see a post-expiration bump in the VIX, expect that by the following Thursday almost all of the move will have evaporated.

For more on the VIX action on Mondays, Fridays, and during the options expiration cycle, click on the appropriate label links at the bottom of this entry.

Tuesday, February 20, 2007

Puts, the VIX and Intra-Month Volatility

If he keeps it up, Bernie Schaeffer is in danger of garnering honorary VIX pundit status, due to his tendency to talk about the VIX almost as much as Adam Warner and I do. Today, Schaeffer discusses the monthly VIX cycle and ties it in with the recent low VIX readings as follows:

“…the relatively low VIX could entice a number of options players to snatch up put options when trading starts today in an effort to lock in some ‘cheap’ protection. This would put downside pressure on the market.

As we have seen in the past, while expiration week tends to be strong for the market, the week following option expiration is often marred by a pullback in the major indices. Frequently, traders will jump back into put positions now that their previous positions have expired. This swelling in bearish bets is accompanied by hedging among the traders who take the other side of that trade and sell the puts, another factor that creates downside pressure.

Turning to a chart of the VIX, I found that over the past year, VIX peaks have been in the first half of the month, with the very notable exception of May 2006 and also November 2006 (July 2006 is on the bubble).

Another way of framing this could be that in the post-expiration period each month (always in the second half), market performance is ‘challenged’ by the fact low VIX periods attract put buyers and stock sellers. A better explanation might be that the rise in the VIX from the second half of a typical month into a peak in the first half of the next month is the result of the accumulation of index puts in the new front month, with the VIX peaking (and selling pressure lifting) once all the put demand is satisfied.”

I made a similar observation on VIX price movements during the options expiration cycle, which was also supported by an examination of VIX prices during the quarterly earnings cycle.

Could cheap portfolio insurance and the options expiration cycle be part of a vicious circle for the VIX? If so, what happens when portfolio insurance gets more expensive and this circle is broken?

I will kick this one around a little and update my thinking here as it evolves.

Friday, January 19, 2007

Volatility: Options Expiration Cycle vs. Earnings Season

For those who wonder why VIX options prices sometimes seem to bear little resemblance to movements in the VIX, Brian Overby at TradeKing has a good article, Decoding the VIX II, that explains how VIX options prices are a function of VIX futures prices, not the underlying VIX prices. (FYI, you can find the first half of Decoding the VIX here.)

Overby discusses some of the implications of this pricing phenomenon and concludes:
"This means that the relationship between the actual VIX index and the VIX options “based” on that index are little hard to follow."
While am quick to nod my head in agreement at this, his metaphor about predicting the weather four months in advance based on current data hits closer to home.
"In simple terms, trading VIX options is like trying to trade options on the temperature at some future date. If, for some odd reason, the temperature in south Florida reaches 120 degrees on October 5, that does not help someone to predict the temperature on February 5 of next year. Perhaps, if there a string of 120-degree days, then, maybe, there could be a trend that might presage a warmer winter and a higher than normal temperature on February. Under normal conditions, however, what happens to the temperature on one particular day in September bears very little relationship to what weather will be in February."
More on what this means to come, but the thoughts here might help those trying to understand some of the many idiosyncracies of the elusive VIX.

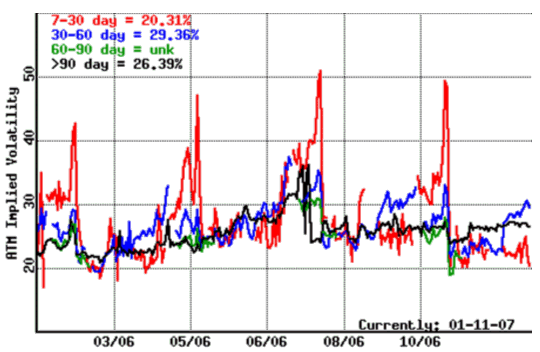
On another front, Clare White at Optionetics.com recently authored CSCO IV Seasonality, which discusses the seasonal implied volatility cycles associated with CSCO and earnings releases. Not surprisingly, graphs of CSCO IV show that IV ramps up in the weeks leading up to earnings and spikes for several days before before earnings, only to subside dramatically after the announcement.
CSCO 2006 implied volatility

The implications, of course, are much broader than CSCO and include the VIX. Since the VIX is looking ahead to volatility over the next 30 days, it is important to know when the S&P500 heavyweights are scheduled to report.

For 2007, I have looked at the reporting dates, by week, for the S&P500 and come up with the following table to identify the number of companies that report each week and in each four week cycle:

Week Current Week Current + 3 Weeks
Week 1 2007 2 166
Week 2 2007 (-1) 4 262
Week 3 2007 (opt exp) 45 307
Week 4 2007 (+1) 115 282
Week 5 2007 98 202
Week 6 2007 49 104
Week 7 2007 20 55

Note that the week after options expirations week is at the peak of the earnings reporting season, with the most companies reporting (115), while the weeks before, during and after options expiration have a roughly equivalent number of companies in the SPX reporting during the four week window that roughly coincides with the VIX futures calculation horizon.

With these two thoughts reverberating in my head, I went back to the VIX Performance During the Options Expiration Cycle post, separated out the prime earnings reporting months (January, April, July and October) and compared them with the other eight non-earnings months. I did this for the week after expiration, which happened to show the highest volatility in my previous analysis. Sure enough, the earnings months were 50% more likely than non-earnings months to show VIX moves to the upside of 10% or 15% and more than twice as likely to show moves of 20% or more.

While the data still support the week after options expiration as the biggest volatility week, it turns out that in non-earnings months, the week after options expiration is no more volatile than average. The bottom line is that, as far as I can tell, it is the proximity to earnings releases that makes the week after options expiration more volatile than other weeks. Perhaps more importantly, in terms of the influence on volatility, earnings season trumps the options expiration cycle by a large margin.

DISCLAIMER: "VIX®" is a trademark of Chicago Board Options Exchange, Incorporated. Chicago Board Options Exchange, Incorporated is not affiliated with this website or this website's owner's or operators. CBOE assumes no responsibility for the accuracy or completeness or any other aspect of any content posted on this website by its operator or any third party. All content on this site is provided for informational and entertainment purposes only and is not intended as advice to buy or sell any securities. Stocks are difficult to trade; options are even harder. When it comes to VIX derivatives, don't fall into the trap of thinking that just because you can ride a horse, you can ride an alligator. Please do your own homework and accept full responsibility for any investment decisions you make. No content on this site can be used for commercial purposes without the prior written permission of the author. Copyright © 2007-2023 Bill Luby. All rights reserved.
 
Web Analytics