Showing posts with label archival. Show all posts

Saturday, December 31, 2016

The Year in VIX and Volatility (2016)

The consensus called for a big uptick in volatility in 2016 and while there was a lot of drama, the VIX spikes were relatively manageable and short-lived.  The VIX opened the year at 22.48 and ended the year at just 14.04.  For the full year, the median VIX was 14.31, while SPX historical volatility for the full year ended up at a mere 13.12.

That being said, there were five distinct VIX spikes in the graphic below, listed according to chronology:
  • Fears related to slowing growth in China (January)
  • A plunge in crude oil prices to $26.05/bbl. for WTIC, as investors grappled with the possibility that Cushing storage facilities would be exhausted (February)
  • The surprise Brexit vote result in favor of the U.K. leaving the E.U. (June)
  • A cocktail of nearly simultaneous shocks from Fed President Rosengren (suddenly sounding hawkish), Jeff Gundlach (interest rates have bottomed) and the European Central Bank (no additional stimulus) puts pressure on stocks (September)
  • Increasing uncertainty leading up to the U.S. election (November) 

In all five instances, the VIX moved up sharply, but in defiance of historical precedent, the volatility index moved down almost as sharply as it moved up.  In fact, some of the biggest extremes for the year came in the form of volatility crushes, where the VIX had an unprecedented series of sharp downward one-day move.  Checking the record books, the only previous year that the VIX posted three top 20 one-day declines was 2007 – and clearly investors were in denial that year.  This year the Trump election caused the sixth largest one-day drop in the history of the VIX, whereas the Thursday before and Tuesday after the Brexit vote triggered the eighteenth and tenth largest one-day VIX declines.

On the other side of the ledger, some of the upward moves in the VIX made the record books as well.  The day following the Brexit vote saw a 49.3% VIX spike – the fifth highest one-day spike on record.  What was even more surprising was the Rosengren/Gundlach/ECB cocktail noted above triggered a 39.9% spike (eleventh highest in history) in what seemed to be a relatively calm market environment in September.  It turns out the VIX was just getting warmed up for greater things, including a record nine consecutive up days leading up to the November election.

Even with these extremes, the highs and lows in the VIX were rather middling, with the VIX peaking at 32.09 on January 20th and hitting an annual low of 10.93 on December 21st.

The graphic below captures these and other highlights from 2016:


[source(s): StockCharts.com, VIX and More]

Included in the non-VIX highlights are a 5000+ year low in interest rates in Europe and Japan (where negative interest rates prevailed) as well as a thirteen-year low in the price of crude oil.  On the geopolitical front, political craziness of one kind or another abounded in Brazil, South Korea, Turkey, Italy, Colombia and South Africa, among other locations.  Terrorism also left its footprint again in 2016 and Zika also created considerable political and social turmoil.  In the financial realm, European banks had a very difficult year and begin 2017 on shaky footing.

While the year ended on a relatively quiet not, I suspect 2017 will have much more in the way of new surprises, including swans of many dark hues.  Next week I will resume the VIX and More fear poll and find out what the consensus is for volatility and its causes in the coming year.

Finally, since 2011, I have been maintaining a proprietary Macro Risk Index that measures volatility and risk across a broad range of asset classes, including U.S. equities, foreign equities, commodities, currencies and bonds.  In 2016, the Macro Risk Index was trending down most of the year, punctuated by significant spikes in February (crude oil) and again in June (European currencies). 

How did 2016 measure up to expectations?  I sum up the year in My Low Volatility Prediction for 2016: Both Idiocy and Genius.  Also worth investigating are a pair of Barron’s articles from one year ago laying out two opposing perspectives on volatility in 2016.  For the case for rising volatility and what to do about it, try Jared Woodard’s Prepare for Rising Volatility in 2016.  I provide the contrarian point of view in The Case Against High Stock-Market Volatility in 2016.

Have a happy, healthy and profitable 2017!

Related posts:


For those who may be interested, you can always follow me on Twitter at @VIXandMore

Disclosure(s): the CBOE is an advertiser on VIX and More

Tuesday, January 5, 2016

The Year in VIX and Volatility (2015)

Every year one of my most-read posts is my annotated overview of the year in VIX and volatility.  Now that I have been doing this for the past eight years, the aggregated view of volatility from 2008 to the present makes for a fascinating concise history not just of volatility, but more broadly of the financial markets and of economic activity in general.

The graphic below captures most of the highlights from 2015 and from a volatility perspective, it was a year for the record books.  During August we saw the largest one-week VIX spike (+113%) that resulted from unprecedented back-to-back days of VIX spikes of more than 45%!  The cumulative jump in the VIX pushed the VIX to a high of 53.29 – the only time outside of the 2008-09 financial crisis since the launch of the VIX in 1993 that the VIX has topped 50.


[source(s): VIX and More]

While most investors pointed to China as the proximate cause of the record VIX spike(s), a VIX and More fear poll one week after the big VIX spike also highlighted “market structural integrity (HFT, flash crash, exchange issues, etc.)” as almost on par with China concerns, with “market technical factors (breach of support, end of trend, etc.)” not that far behind.

The balance of the year saw a wide variety of events that moved the markets, including the Fed’s first rate hike in nine years; crude oil plummeting to $34/bbl.; shock waves in the high-yield bond market due to low oil prices; chilling terrorist attacks in Paris and in California; Puerto Rico announcing it will default on some of its debt; turmoil in the currency markets when the Swiss National Bank ended the peg of the Swiss franc to the euro; a dramatic boom-bust cycle in Chinese A-shares – and a flurry of ineffective interventions on the part of the Chinese government to restore stability; a proxy war between Saudi Arabia and Iran in Yemen; and the European Central Bank committing to $1.2 trillion of quantitative easing.

As noted previously, even with all of the volatility, Every Single VIX ETP (Long and Short) Lost Money in 2015.

Finally, since 2011, I have been maintaining a proprietary Macro Risk Index that measures volatility and risk across a broad range of asset classes, including U.S. equities, foreign equities, commodities, currencies and bonds.  In 2015, the Macro Risk Index was consistently higher than it has been during any year since the 2011 inception.

What does high volatility in 2015 mean for 2016?  During the past two weeks, Barron’s published two opposing (but not necessarily inconsistent) perspectives on volatility in 2016.  For the case for rising volatility and what to do about it, try Jared Woodard’s Prepare for Rising Volatility in 2016.  I provide the contrarian point of view in The Case Against High Stock-Market Volatility in 2016.


Related posts:


Disclosure(s): net short VIX at time of writing

Sunday, January 25, 2015

The Year in VIX and Volatility (2014)

This is the seventh year in a row I have offered a retrospective look at the year in VIX and Volatility, which is my attempt to cram some of the highlights of the year in volatility onto one eye chart graphic with a (somewhat) manageable number of annotations.

In aggregate, 2014 was a very quiet year for the VIX, with a mean close of just 14.19 for the year, which is the lowest the VIX has been since 2006 and third lowest since 1995. On the other hand, as I recently documented, VIX spikes were common last year, with 2014 registering the third highest number of 20% VIX spikes since the beginning of VIX data, in 1990. In short, the VIX was susceptible to large spikes, but these were typically followed by strong mean-reverting declines. For example, the peak VIX of 31.06 on October 15 was the highest VIX reading since 2011, yet just six weeks later the VIX was back in the 11s.

When asked in October what they perceived as the biggest threat to stocks, respondents to the VIX and More fear poll pointed to the end of quantitative easing and the removal of the Fed safety net as their top concern, with Ebola narrowly edging out the much more nebulous “market technical factors” for the second slot. As best as I am able to determine, it was the panic associated with fears of an Ebola epidemic that took an already elevated VIX and pushed it up into the 30s.

At various times during the year, Ukraine/Russia, crude oil, ISIS/ISIL, Israel/Gaza, the Fed and the European Central Bank all managed to increase anxiety and perceptions of risk among investors. Also, the narrow miss in the vote for Scottish independence created turmoil in the United Kingdom and across the euro zone, but managed to avoid morphing into another nationalist crisis. Early in the year, there was a currency crisis in emerging markets that was triggered by (unfounded, in retrospect) concerns about higher interest rates in the U.S. Throughout the year there were concerns about valuations and excesses momentum trading in the likes of biotechnology, social media, internet and solar stocks. To some extent, these concerns peaked in April (see The Correction as Seen in the ETP Landscape for additional details), only to return periodically throughout the balance of the year.

The Year in VIX and Volatility 2014

[source(s): StockCharts.com, VIX and More]

Last year at this time, the prevailing worries were focused on whether or not Fed Chair Janet Yellen was leaning toward a more hawkish stance, the inevitable march to higher interest rates in the U.S., the weakening of emerging markets currencies and the potential fallout from the Fed’s tapering of bond purchases. In retrospect, investors were largely worrying about the wrong things.

The first few weeks of 2015 have seen Greece, Saudi Arabia and Ukraine back in the spotlight, with the Swiss National Bank and European Central Bank dominating news on the central banking front. If the past is any guide, the big issue for 2015 has yet to rear its ugly head, whether it turns out to be a gray, charcoal or black swan.

Related posts:

Disclosure(s): none

Top Posts of 2014

Since I launched VIX and More some eight plus years ago, I have devoted one post to highlighting the top 25 most-read posts of each year. I do this in part for archival purposes: to see what is important to readers and how their interest in various issues changes over time. I also hope that these aggregations of most-read posts will serve as relatively easily accessible repositories of high-quality material for the benefit of new readers and long-term readers alike.

During 2014, the blog saw an extended hiatus for the first time in its history, largely due to events arising from the passing of my father. For this reason, I am limiting the number of top posts for the year to thirteen, largely because Song for My Father* ended the year in the #13 slot.

Looking ahead, volatility is back and so am I. I miss writing and I miss the interaction with readers. In the coming year I will significantly ramp up my activity on the blog and also in the comments section. I will also continue to write a weekly newsletter specializing in volatility (which just so happens to have a 14-day free trial), pen periodic guest columns for Barron’s and perhaps contribute to some other publications as well.  All this will be in addition to my primary role, which is that of an investment manager.

In 2014, some of the top stories were Ebola, Ukraine vs. Russia, crude oil, ISIS/ISIL, the Fed and the European Central Bank.  The posts below represent those that have been read by the highest number of unique readers during 2014. Farther down there are links to similar lists going back to 2008, along with several other “best of” type posts that I have flagged for archival purposes.

For the record, each year I also attach the hall of fame label to a handful of posts that I believe have particularly compelling and/or original content, regardless of readership. I was a tough grader last year, as I only added one new post to the HoF in 2014, but I already have an addition for 2015 and my goal is to continue to crank out Hall-of-Fame-worthy posts on a regular basis in 2015 – and even manage to do it without assistance provided by performance-enhancing drugs…

With an increase in posting on the blog, I also foresee a substantial uptick in my activity on Twitter, where @VIXandMore gives me a platform to contribute more in terms of time-sensitive news, short-term insights and other related subjects.

The thirteen most-read posts on VIX and More in 2014 were:

Related posts:

Disclosure(s): none

Thursday, October 16, 2014

Fear Poll: Fed/QE, Ebola and Technicals Top Worry List

Stocks may be in the process of putting in a bottom, but with the VIX hitting 31.06 yesterday at the same time VIX futures were setting new volume records, investor fear and anxiety is as high as it has been since the 2011 European sovereign debt crisis.

As the VIX and More Fear Poll results reflect, the current situation is particularly difficult for investors to grapple with because there is so much disagreement about what the biggest worry is and how some of these fears may be connected.

In the chart below, I have summarized the almost 400 votes from some 35 countries, with the U.S. accounting for 65% of all respondents.

It is worth noting that the responses appear to be somewhat headline driven, as yesterday Ebola topped the list of worries, only to be supplanted by concerns about the impact of the Fed ending quantitative easing and in so doing removing the safety net that has helped keep liquidity high, volatility low and investors more confident. I also find it particularly interesting that “market technical factors (breach of support, end of trend, weak internals, etc.)” are so important to a broad range of investors, which raises the question of whether technicals are more of a cause or effect in the recent downturn.

Looking at global economic weakness, slightly more investors expressed concern about the U.S. economy than that of the euro zone, with concerns about the Chinese economy a distant third.

In these types of polls, I am always interested to see how U.S. respondents differ from those outside of the U.S. In the current market environment, U.S. respondents tend to place more emphasis on the weak U.S. economy and the Ebola virus, while paying less attention to currency issues and China. Some of the detailed results certainly have a whiff of provincialism, yet it remains to be seen whether the global or Americentric perspective does a better job of honing in on what to focus on – a subject I will delve into at a later date.

For those who might be interested in the results of prior VIX and More Fear Poll data, the links below should be a helpful reference.

Last but not least, many thanks to everyone who participated in this poll, which I intend to periodically reprise as market conditions warrant.

VAM Fear Poll 101614

[source(s): VIX and More]

Related posts:

Disclosure(s): none

Sunday, January 26, 2014

Performance of VIX ETPs in 2013

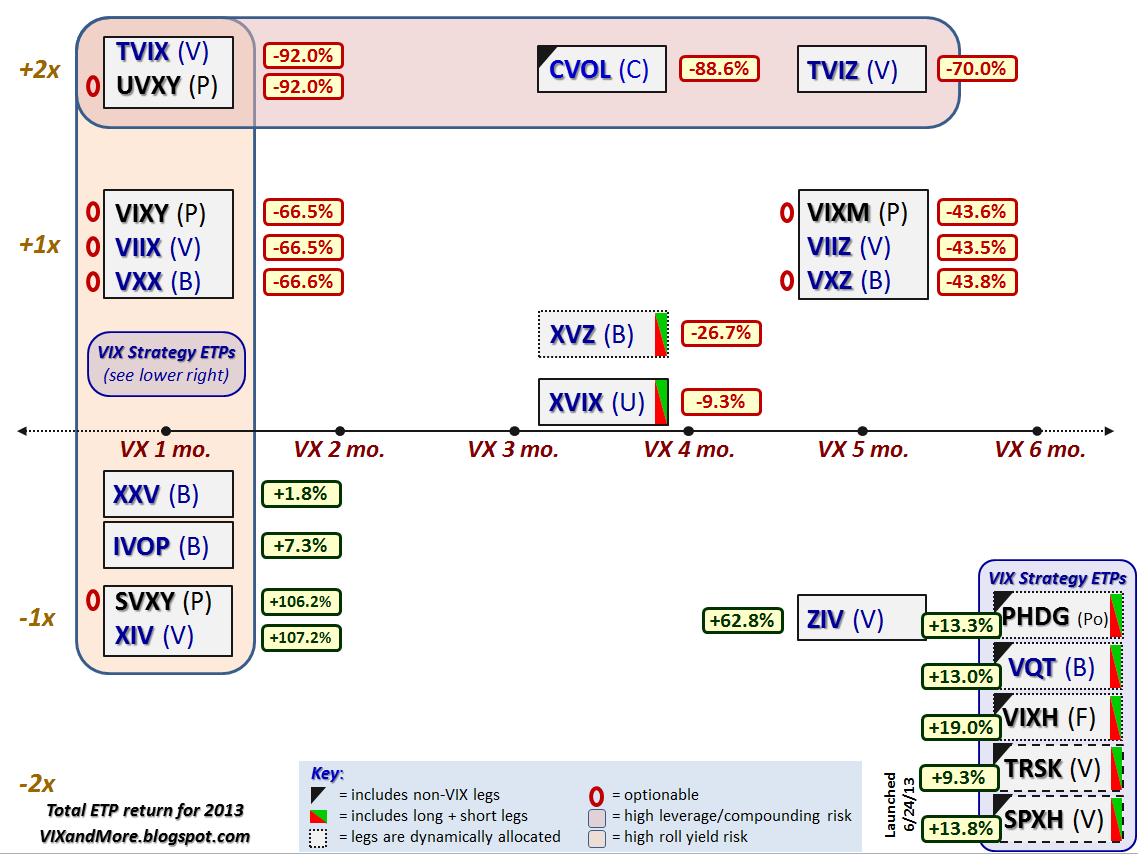
A number of readers have asked me to recap the performance of the VIX ETPs in 2013 according to the leverage/maturity grid I have been publishing for several years.

The graphic below should look familiar to long-term readers and measures the performance of all VIX and volatility ETPs for 2013, including dividends. (Two exceptions are TRSK and SPXH, which have data going back to June 24, 2013 and as such, the closing price on that date is treated as the opening price for 2013.)  This time around I am going to refrain from most editorial comments, yet point out that the data bears a very strong resemblance to what I presented in VIX ETP Performance in 2012.  It is also worth noting that just because there were similar numbers in 2012 and 2013, one should not expect these patterns to repeat on a regular basis. In Performance of VIX ETPs During the Recent Debt Ceiling Crisis, for instance, I present a very different set of data that students of volatility should also pay close attention to.

[source(s): CBOE, Yahoo, VIX and More]

For a more detailed discussion of the performance drivers of various VIX ETPs and for additional performance data and commentary, the links below should provide an excellent jumping off point.

Related posts:

Disclosure(s): none

The Year in VIX and Volatility (2013)

This is the sixth year in a row I have offered a retrospective look at the year in VIX and Volatility, which is my attempt to cram the highlights of the year in volatility onto one graphic with a manageable amount of annotations.

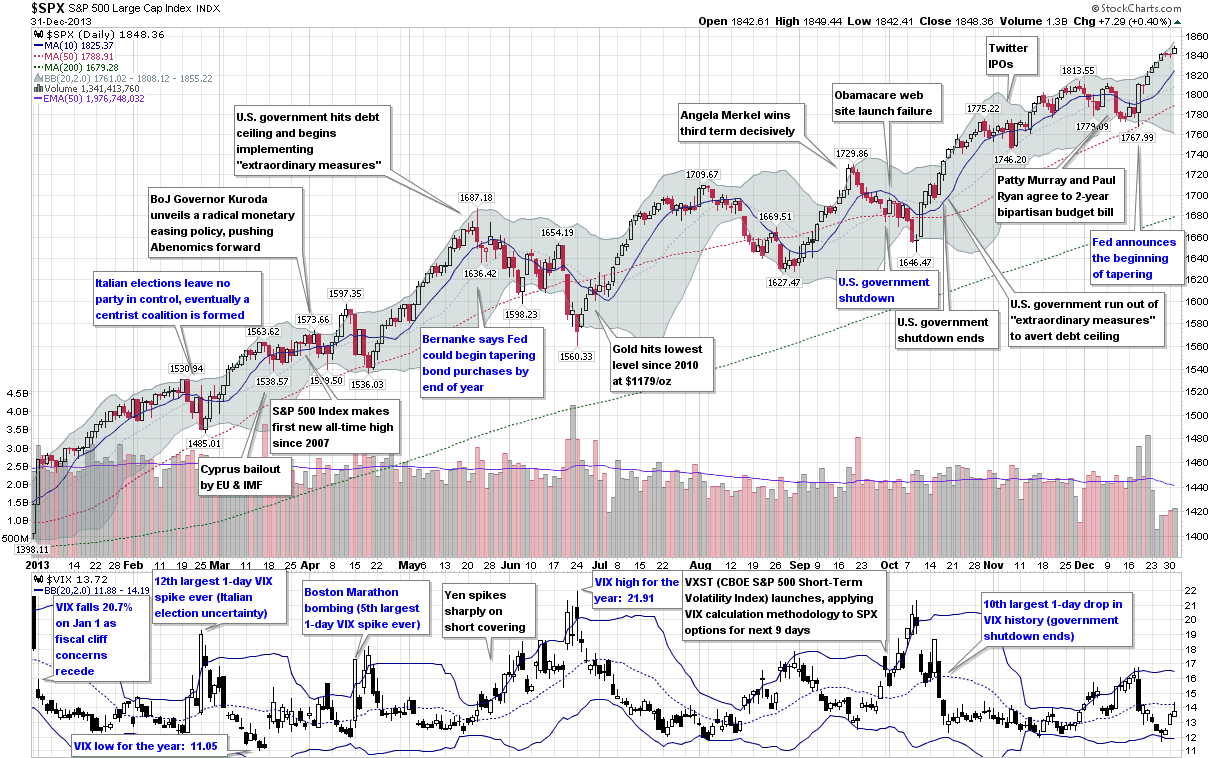
In terms of equity volatility and specifically the VIX, 2013 was the story of a persistent bull market in stocks and very little in the way of implied or realized volatility, at least by historical standards. In fact, the VIX’s high water mark of 21.91 was the second lowest annual high point since 1995, eclipsed only by the Greenspan liquidity flood in 2005. Similarly, the average VIX in 2013 was just 14.23, considerably lower than the long-term average, which is a shade over 20. The year only saw two days in which the SPX was up 2% or more and another two days in which the SPX was down at least 2%, the fewest number of such days since 2006.

Even though the numbers may not be impressive, there were still some significant events during the course of the year that were able to provoke substantial anxiety and fear, at least for the short-term. The year began with the Fiscal Cliff drama coming to an end and saw fear in the euro zone heat up after the Italian elections ended with a parliamentary deadlock and Cypriot banks triggered a joint EU/IMF bailout of Cyprus. The Boston Marathon bombings provided a jolt of terrorist fear in April and fears about Japan the future of Abenomics created huge volatility in the yen, with ripple effects felt across currency markets and in many related financial markets during May and June.

In the U.S., the Fed tapering scenarios dominated the investment landscape during the second half of the year and the debt ceiling crisis, government shutdown and entrenched bipartisan bickering cast many doubts about the potential for some huge self-inflicted wounds.

In the end, the SPX set 44 new all-time closing highs in 2013 and the VIX ended the year almost 24% below where it finished in 2012, though the Fiscal Cliff was responsible for most of that gap.

[source(s): StockCharts.com. VIX and More]

So far 2014 looks more interesting from a volatility perspective, but the year is young and the volatility story is always one of surprises in the form of swans with dark gray plumage.

Related posts:

Disclosure(s): none

Top Posts of 2013

Every year I tabulate the most-read posts in this space as a way to monitor the issues that are resonating with readers and also to see how these issues evolve over time. These most-read posts also serve as easily accessible repositories of high-quality material for the benefit of new readers and long-term readers alike.

The top themes from 2013 echo some top themes that resonated with readers from previous years, including continued interest in VIX spikes and SPX pullbacks, as well as the VIX ETPs, low volatility ETPs, the Fed, interest rates and various global flash points, such as emerging markets.

The posts below represent those that have been read by the highest number of unique readers during 2013. Farther down there are links to similar lists going back to 2008, along with several other “best of” type posts that I have flagged for archival purposes.

For the record, each year I also attach the hall of fame label to a handful of posts that I believe have particularly compelling and/or original content, regardless of readership. I find it interesting that ten posts from 2013 made it into the hall of fame – a record for any single year. Part of the reason for this is that while my total number of posts for 2013 was low, I favored quality and more in-depth analysis than pithy commentary, most of which I have migrated to my Twitter handle feed, @VIXandMore

The most-read posts on VIX and More in 2013 were:

Related posts:

Disclosure(s): none

Monday, July 1, 2013

Top Posts of 2013 (Through First Half of Year)

Every year I tabulate the most-read posts in this space as I find this exercise to be an excellent way to identify the issues that are resonating with readers and also to see how these issues evolve over time. These most-read posts also serve as easily accessible repositories of high-quality material for the benefit of new readers and long-term readers alike.

A number of themes seem to be top of mind for 2103 so far. Clearly the VIX ETPs and their construction and valuation quirks continue to be a huge issue, as is their performance during various volatility regimes. On a related note, low volatility ETPs generated considerable press and interest toward the beginning of the year and as volatility picked up in the second quarter, readers gravitated toward information on VIX spikes and various ways to measure and evaluate risk.

The posts below represent those that have been read by the highest number of unique readers during the first half of 2013. Farther down there are links to similar lists going back to 2008, along with several other “best of” type posts that I have flagged for archival purposes.

For the record, each year I also attach the hall of fame label to a handful of posts that I believe have particularly compelling and/or original content, regardless of readership.

Related posts:

Disclosure(s): none

Wednesday, January 2, 2013

The Year in VIX and Volatility (2012)

Every year I assemble a chart that is my retrospective look at the year in volatility. While 2012 was the first year since 2006 that the VIX failed to make it out of the 20s, this was not due to an absence of threats to the stock market.

During the first half of the year, the euro zone was the primary concern for most investors, with the events surrounding the two nail-biting elections in Greece haunting the markets from April through June. With Greece off of the front page, focus of the European sovereign debt crisis shifted to unsustainable government debt yields in Spain and Italy, which only began to turn around after Mario Draghi pledged to do “whatever it takes” to save the euro in July.

Meanwhile, markets in the United States were relatively calm due to the repeated intervention of the Fed, which offered up QE 2.5, QE3 and QE4. The global economy also found support in the form of central bank stimulus plans from China, Japan and the euro zone.

The last hurrah for the VIX and volatility in 2012 was the fiscal cliff, which was largely overlooked during the U.S. elections, but dominated the headlines even before the last vote was counted. The fiscal cliff issue remained the #1 source of concern for investors throughout the balance of the year and had the VIX moving counter to its usual direction for most of December.

As 2013 dawns, fears related to the fiscal cliff are plummeting and dragging the VIX down with it, but clearly the issues that have kept the financial markets on edge for the past few years are not yet behind us and unseen risks are always lurking just over the horizon.

[source(s): StockCharts.com]

Related posts:

Disclosure(s): none

Monday, December 31, 2012

Top Posts of 2012

Every year I tabulate the most-read posts in this space as I find this exercise to be an excellent way to identify the issues that readers are interested in and also to see how these issues evolve over time. These most-read posts also serve as easily accessible repositories of high-quality material for the benefit of new readers and long-term readers alike.

While 2012 was a slow year for the VIX (the first time the VIX didn’t make it into the 30s since 2007), it proved to be an exciting time for the broader volatility products space. Looking just at the titles of the top 25 posts below, an astonishing 9 of them reference TVIX or UVXY in the title, reflecting strong reader interest in the +2x volatility products that I called “day trading rocket fuel” back in January 2011.

The posts below represent those that have been read by the highest number of unique readers in 2012. Farther down there are links to similar lists going back to 2008, along with several other “best of” type posts that I have flagged for archival purposes.  Don’t necessarily start at the top and work your way down until you get bored.  For the record, I think #25, Volatility During Crises is one of the top two posts of the year.  I’m not sure about #1, but Cheating with Partial Hedges, which didn’t even make this top 25 list, also has to be considered a strong candidate.

Last but not least, each year I also attach the hall of fame label to a handful of posts that I believe have particularly compelling and/or original content, regardless of readership.

Happy New Year!

Related posts:

Disclosure(s): short UVXY at time of writing

Friday, June 29, 2012

Top Posts of 2012 (Through the First Half of the Year)

Every year I tabulate the most-read posts in this space and as the halfway mark falls on a weekend this year and in the midst of considerable turmoil in Europe, China and the United States, I thought I would provide a mid-year update for those who may be interested in doing some weekend reading.

The posts below represent those that have been read by the highest number of unique readers in 2012. Farther down there are links to similar lists going back to 2007, along with several other “best of” type posts that I have flagged for archival purposes.

For the record, each year I also attach the hall of fame label to a handful of posts that I believe have particularly compelling and/or original content, regardless of readership.

  1. Will TVIX Go To Zero?
  2. Volatility Becomes Unhinged on Friday
  3. A Million SPX Contracts Traded Today…A Contrarian Timing Signal
  4. Four Key Drivers of the Price of TVIX
  5. Credit Suisse Suspends Creation Units in TVIX: What It Means
  6. All About UVXY
  7. Who Is Trading TVIX?
  8. What the VIX Kitchen Sink Chart Says
  9. Natural Gas, Contango and UNG
  10. A VIX of 15!?! Meet the New Reality
  11. VXX Options Calm After Second Highest Volume Day Ever
  12. Third Steepest First-Second Month VIX Futures Contango Ever
  13. Dynamic VIX ETPs as Long-Term Hedges
  14. TVIX Premium to Indicative Value Creeping Back Up
  15. Implications of a Positively Correlated SPX and VIX
  16. Putting the Recent 2.6% SPX Pullback in Historical Context
  17. TVIX Creation Units Return; What It Means for Investors
  18. Geography, Focus and Strategy
  19. The Story of VIX ETPs Relative to Their Intraday Indicative Values
  20. A Look at Pullbacks of the 2009-2012 Bull Market
  21. Is TVIX Now Just a More Docile UVXY?
  22. The VIX-VXX Minotaur Trade
  23. Five Years of VIX and More
  24. The Ups and Downs of the New Premium in TVIX
  25. An Updated Field Guide to VIX ETPS

Related posts:

Disclosure(s): none

Saturday, January 14, 2012

Five Years of VIX and More

One week ago marked five years since my first post at VIX and More. Since this anniversary fell just after my Top Posts of 2011 entry, it seemed like another retrospective look at the blog might be one too many. After a week of reflection I am now convinced that The 1000th Post is probably best left unchallenged (for now at least) as my definitive history of the ideas represented on this blog and a good reference for relatively new readers. Another link worth highlighting is the hopefully self-explanatory The Post of the Month: An Informal History of VIX and More. Last but not least, for those interested in the best of the archives, those few posts with the hall of fame label are among my personal favorites.

In order to mark the five-year anniversary, I have elected to highlight the ten most-read posts on the blog since its inception, with some commentary about each post.

  1. Ten Things Everyone Should Know About the VIX – If there is one post on this blog that everyone could benefit from – and new readers might wish to start with – this is the one. I last updated the contents of this post in 2010 and I will be sure to revise it again in the near future.
  2. How to Trade the VIX – This is a fairly basic explanation about how to trade the VIX that probably benefits from having a title that positions it well for Google searches. There are a number of related posts about how to trade the VIX (some of which are links in the original), but here is a case where I should also have an updated look at the subject, with some more comprehensive information.
  3. VXX Calculations, VIX Futures and Time Decay – I find it interesting that a post which was unable to crack the top ten in the year it was written (2009) is now in the top three of all time. I believe this was the first explanation anywhere went into the details of the VIX futures roll yield and the math involved persistent contango and the resulting price decay in VXX. As so many traders have taken up the cause in trading VXX and related products, this post has become an invaluable educational resource and is frequently linked to almost three years later.
  4. Why VXX Is Not a Good Short-Term or Long-Term Play – Written several months after the post above, this extended some of the ideas that I had fleshed out earlier in a manner that investors have found helpful regardless of the time frame in which they are trading.
  5. Prediction: Direxion Triple ETFs Will Revolutionize Day Trading – One thing I tried to do when I started this blog was to focus on educational material instead about talking about my trades or what I was expecting from the markets. Every once in a while, however, there were some things that I saw as very likely to happen that cut against traditional thinking. This triple ETF call was one of those and also helped to attract attention to these new products.
  6. Chart of the Week: Might Recent Volume Bottom Doom Stocks? – I was surprised to see this post on the last as the analysis is probably not among my best thinking. What I believed happened was that at the time this was written, investors had become concerned that stocks had rallied too sharply off of their March 2009 lows and were likely to run out of steam soon. As it turns out, stock sold off for about two weeks after this post, falling back to SPX 869, then resumed their bullish momentum.
  7. What Is High Implied Volatility? – This post from 2008 helped to explain several different ways of evaluating implied volatility relative to various benchmarks, at a time when investors were becoming increasingly concerned about volatility. Questions about implied volatility continue to be big issues for new options traders.
  8. SPX 15% Over 200 Day Moving Average for First Time in Ten Years – While I will probably never get a job writing headlines for the New York Post, every once in a while my research and analysis uncovers something that has widespread appeal and a catchy enough headline to attract a lot of attention. While this headline and the accompanying graphic sound ominous, stocks shook off the bearish warning and continued to rally.
  9. Rule of 16 and VIX of 40 – When people try to explain to me why they like the blog, what usually comes out is some sort of variation of, “You make very technical material easy to understand.” This post is probably one of the better examples of this. Many people struggle with some of the math associated with the VIX and having read this, I know the lights have gone for a number of investors.
  10. Lost in Translation: VXX and VXZ – This post preceded #3 and #4 on this list and  was probably the first piece published anywhere that talked about the beta of VIX, VXX and VXZ relative to SPX. Most investors had not figured out what to expect with VXX and VXZ in terms of VIX moves back in April 2009 – and quite a few still struggle with this issue to this day.

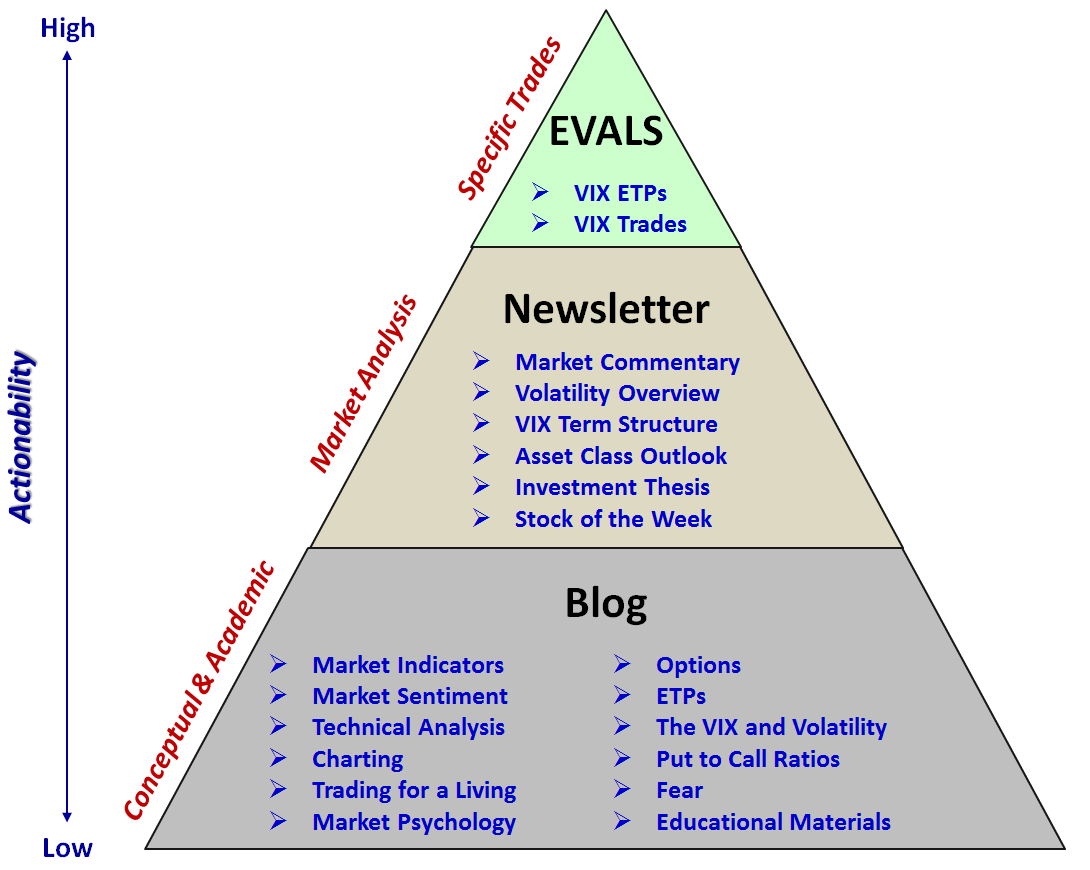
Finally, one recent development worth noting is the re-launch of EVALS (ETP Volatility Analysis Long-Short) in November. EVALS is now focusing on VIX-based ETPs and this has created some confusion from readers about what content is on the blog, what is in the newsletter and what is in EVALS. For this reason, I have created a content pyramid below which should help to differentiate between what can be found where. Of course the blog is free to all, while the newsletter and EVALS are available only to subscribers.

Related posts:


Disclosure(s):
short VXX at time of writing

Thursday, January 5, 2012

VIX and More and the 2012 Bespoke Roundtable

I was delighted to be invited back for the third year in a row to share my thoughts about 2011 and 2012 as a part of Bespoke Investment Group’s third annual Roundtable.

As someone who trades options, just predicting what one stock or index will do over the course of a four-week expiration cycle can be a humbling experience. Since I rarely focus the bulk of my thinking more than two or three expiration cycles into the future, I always embrace the process of what I have come to think of as Bespoke’s comprehensive 37 question “take-home final.” Of course you don’t have to have an opinion about every issue out there to be a successful investor, but being informed about as many issues as possible makes you better prepared when the next surprise hits. As I noted in The Education of a Trader, anyone who has ever uttered, “Do we have to know this for the test?” is not cut out for trading, as every day in the financial markets is an open book pop quiz.

When it comes to formulating answers to these 37 questions, I tried to balance what I think are the most likely scenarios with more provocative comments about some low probability scenarios that I believe that a higher likelihood of coming to fruition than the rest of the crowd. The result is typically a patchwork of the unexciting and the outrageous. In 2012 it looks like I am leaning more toward the unexciting end of the scale, which is not difficult to do in a year in which the Mayan calendar may be predicting the end of the world, while many pundits are calling for at a minimum the end of the euro zone as we know it. That being said, I do think I have some provocative things to say about a wide range of issues, from Apple (AAPL) vs. Google (GOOG) to social networking and beyond.

The full set of my comments for 2012 is here.

For those who are curious how my crystal ball has fared in years past, my archived predictions for 2010 are here. If I can locate a link to my (decidedly less impressive) 2011 predictions, I will post that here as well.

I also recommend reading through some of the comments from the other participants in the 2012 Bespoke Roundtable. A splash page for the full set of predictions is here.

Related posts:

Disclosure(s): none

Monday, January 2, 2012

The Year in VIX and Volatility (2011)

One of the most-loved charts I assemble each year is my retrospective look at the year in volatility. I already touched on some of the highlights of event volatility in text form in Expectations, Surprises and Fear in 2011, but this is one case in which I believe a picture does a better job of telling the story in the context of a timeline for the entire year.

From a volatility perspective, the first half of 2011 was relatively benign, even though the global social and economic fabric was ripped by Arab Spring and the Japanese trio of disasters which came in the form of the earthquake, tsunami and nuclear meltdown.

Things were much more promising during the middle of the year when the Greek parliament voted in favor of austerity and the euro zone agreed to expand the European Financial Stability Facility (EFSF) to €780 million.

For a while, there was considerable angst surrounding the bipartisan politics associated with the U.S. debt ceiling deadline at the beginning of August, but only after the Democrats and Republicans failed to come up with a meaningful debt reduction deal did investor anxiety shift back to Europe. Ironically, the downgrade of the U.S. debt from AAA to AA+ had very little impact on Treasury securities, which actually began to rally sharply after the downgrade. When Europe returned to the center stage, however, the sovereign debt crisis was escalating rapidly and it was now Italy that was in the crosshairs. The VIX shot up to 48 on August 8th and was regularly above 30 through the end of November, setting a new record for persistent backwardation in the VIX futures in the process.

The VIX was a high wire act throughout August and September, with multiple excursions into the 40s. Even after the S&P 500 index bottomed on October 4 at 1074, the VIX remained stubbornly elevated in October and November, before finally falling into the 20s in December. While the SPX was essentially unchanged for the year, the VIX ended 2011 at 23.40, up 31.8% over 2010’s close of 17.75. At the same time, the VIX futures are calling for a VIX of between 29 and 30 by the mid-point of 2012, suggesting that volatility will climb higher once again in the coming months.

In a year where most asset classes struggled mightily, volatility was one of the few great long positions. With a higher starting point going into 2012, it will be difficult for the VIX to repeat its market-beating performance once again, but if the euro zone and some of the geopolitical flash points fail to make progress, 2012 may indeed be the year of the VIX.

Finally, since I had so many requests for a high-resolution version to download last year, I am going to preemptively offer a full resolution PNG screen capture of the graphic below for download here.

Related posts:


[source(s): StockCharts.com]


Disclosure(s): none

Thursday, December 29, 2011

Top Posts of 2011

It seems hard to believe, but next week I will celebrate the fifth year anniversary of my first post (VIX and More: An Introduction) at VIX and More. Traditionally I have set aside some time at the end of the year to recognize the top 25 most read posts for archival purposes and as a proxy for how well some of what I have written has resonated with a broad base of readers. For the record, each year I also attach the hall of fame label to a handful of posts that I believe have particularly compelling and/or original content, regardless of readership.

Looking at the top posts of the year below, this is the first year there has been a strong representation from shorter more Twitteresque posts, with a diminution of the long-winded more academic research pieces that have populated these lists in past years. Part of this is no doubt due to timing. By way of illustration, when the VIX is over 40, pretty much anything I post is going to attract a wide audience of people who want to know how to interpret recent market moves and understand the implications for the direction of stocks and volatility going forward. On the other hand, when I write one of my better thought pieces and the VIX is at 14, it is sometimes a struggle for that post to find a broad audience.

Another theme I noticed this year is that the list is heavier than usual on the VIX, VIX-based exchanged-traded products and volatility subjects. In previous years I have enjoyed straying for the central themes of this blog and have used features such as the Chart of the Week (discontinued in February when my blogging took a back seat to family matters, but likely to return in 2012) as an excuse to focus on a broader basket of investment themes.

This year has been a target-rich environment in the volatility space and I hope I have been able to expand the knowledge base of those who visit here on a regular basis. Thanks to all whose efforts have contributed to making VIX and More what it is and best wishes for a healthy, happy and prosperous 2012.

  1. VIX Term Structure Evolution Over the Last Ten Days
  2. VIX Suggests Investors Don’t Believe Rally Is Sustainable
  3. Shorting VXX and Long XXV or XIV
  4. The Year in VIX and Volatility (2010)
  5. VIX Backwardation Commentary
  6. Echo Volatility and Another VIX Double Top
  7. Managing Risk with a Short VXX Position
  8. S&P 500 Index 20-Day Historical Volatility Hits 39-Year Low
  9. Front Two Months of VIX Futures Slip Back Into Contango
  10. SPX Pullback History, 2009-2011
  11. VIX Over 31 and SPX Down 12.5% from Peak as Bottom Nears
  12. Chart of the Week: The Year in Economic Data (2010)
  13. Chart of the Week: World Food Prices
  14. VIX Sets Some New Records, Suggesting Volatility Near Peak
  15. Chart of the Week: VXX Celebrates 2nd Birthday
  16. New VIX Backwardation Record
  17. VIN, VIF and an Obsolete VIX
  18. Now Sixteen Volatility ETPs, Four of Which Are Optionable
  19. Economic Data Not Supporting Gloom and Doom Forecasts – At Least for Now
  20. VIX Reflecting Skepticism About Rally
  21. Initial Thoughts on Using the iPad for Trading
  22. The Convergence of VIX and VIX Futures at Expiration
  23. Is Volatility a Better Play for Silver Than Direction?
  24. December Is the Cruelest Month…For the VIX
  25. Chart of the Week: the VIX Since 2007

Related posts:

Disclosure(s): none

Saturday, February 26, 2011

Blog Posting to Resume this Weekend

Thanks to all who have inquired about my absence and health.  It turns out that I have been under the weather, then taking some time off.  Originally I had intended to post more intermittently rather than coming to a complete stop, but now I am back to a normal posting schedule.

The recent volatility spike has generated dozens of questions and I will try to address as many of those as possible as posting begins to return to normal this weekend.  I have also managed to fall far behind on emails and blog comments and will do my best to get caught up in this department as soon as I can.

In the interim, for those who are new to VIX and More or may be looking to cherry pick some of the best posts from the past in order to help shed light on the current situation, the following will certainly be of interest:

Note also that for certain posts which have a comprehensive retrospective view of content in the blog (such as this one) or critical market events, I have labeled these with an 'archival' label.  Just click on the link to pull up all posts with a similar label.  For more basic educational content, try the 'educational' label.  Finally,  for those who are interested in posts on specific subjects, use the hyperlinks for subjects such as VXX, contango, VIX futures, VIX options, VIX spikes, etc.

Of course there is also the custom Google search bar in the right hand column just below the CBOE:RMC ad for specific keyword searches on this site.  Which reminds me, I will be attending the aforementioned CBOE Risk Management Conference.  If you are a reader and wish to say hello, this is an excellent time to do it.

DISCLAIMER: "VIX®" is a trademark of Chicago Board Options Exchange, Incorporated. Chicago Board Options Exchange, Incorporated is not affiliated with this website or this website's owner's or operators. CBOE assumes no responsibility for the accuracy or completeness or any other aspect of any content posted on this website by its operator or any third party. All content on this site is provided for informational and entertainment purposes only and is not intended as advice to buy or sell any securities. Stocks are difficult to trade; options are even harder. When it comes to VIX derivatives, don't fall into the trap of thinking that just because you can ride a horse, you can ride an alligator. Please do your own homework and accept full responsibility for any investment decisions you make. No content on this site can be used for commercial purposes without the prior written permission of the author. Copyright © 2007-2023 Bill Luby. All rights reserved.
 
Web Analytics