Showing posts with label Japan. Show all posts

Tuesday, March 18, 2014

CBOE Risk Management Conference Update

Today was the first full day of the CBOE Risk Management Conference and between the presentations, sidebar conversations and opportunities to meet and greet, I have to say that things hit full stride very quickly.

Today CBOE CEO Ed Tilly announced that the CBOE will roll out nearly 24 hours of trading, five days per week in VIX futures beginning on Sunday, June 22. This announcement follows another important announcement last week that options on VXST (the CBOE Short-Term Volatility Index) will commence on April 10. Clearly, things continue to move forward on the volatility product front and at the end of the year, I suspect we will lock back on these two developments as critical milestones in the volatility space.

Today I had the opportunity to listen to Marvin Zonis give a keynote address on “New Insights into Geopolitical Risk: Examining Geopolitical Risk Hot Spots and the Implications for Trading Strategies and Risk Management.” For anyone wondering about what it might take to drive the VIX higher over the course of the next few years, Zonis had a laundry list of grave concerns (Ukraine, Japan/China, Korean Peninsula, Pakistan, Iran/Israel/nuclear weapons, Egypt/Syria/Turkey, China, political stagnation, etc.) and summarized the situation by saying, “We are in the age of major, major political risk.”

Another featured speaker was Maneesh Deshpande, who talked extensively about the evolution of the demand for volatility products as well as the evolution of the supply for volatility products. Maneesh had a number of interesting observations about new players and new strategies in the volatility space. He also expressed concern about the crowded VIX short trade and the potential for the next crisis that does not mean-revert quickly to lead to a sharp second VIX spike as shorts scramble to cover their positions.

Also of interest was a two-part presentation with Dominic Salvino discussing VXST and other volatility index products (he expects interest in VXST futures will pick up dramatically after the options are launched in less than a month) as well as a detailed description of the VIX settlement process (VIX SOQ) by Bill Speth of the CBOE

Other sessions I attended today included:

  • a panel on volatility as an asset class that produced considerable debate on the proper answer to that question as well as a good deal of criticism of tail risk strategies
  • two speakers on trading volatility across asset classes that shared details on the methodology they use to generate trade ideas as well as quite a few cross-asset class pairs trades

Last but not least, I had the opportunity to meet quite a few people who have been regular readers of VIX and More over the years, many of whom nudged me to ramp up my posting frequency – which I certainly intend to do in 2014, starting this week.

Related posts:

Disclosure(s): CBOE is an advertiser on VIX and More

Sunday, January 26, 2014

The Year in VIX and Volatility (2013)

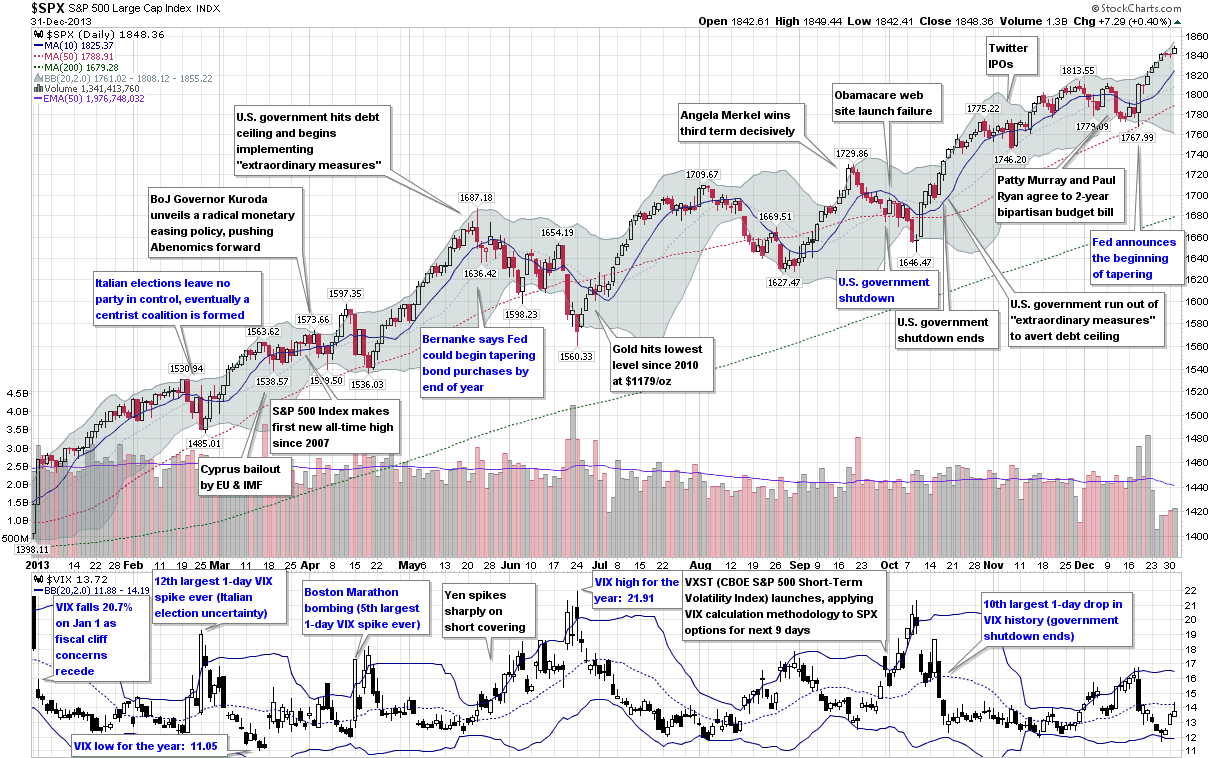
This is the sixth year in a row I have offered a retrospective look at the year in VIX and Volatility, which is my attempt to cram the highlights of the year in volatility onto one graphic with a manageable amount of annotations.

In terms of equity volatility and specifically the VIX, 2013 was the story of a persistent bull market in stocks and very little in the way of implied or realized volatility, at least by historical standards. In fact, the VIX’s high water mark of 21.91 was the second lowest annual high point since 1995, eclipsed only by the Greenspan liquidity flood in 2005. Similarly, the average VIX in 2013 was just 14.23, considerably lower than the long-term average, which is a shade over 20. The year only saw two days in which the SPX was up 2% or more and another two days in which the SPX was down at least 2%, the fewest number of such days since 2006.

Even though the numbers may not be impressive, there were still some significant events during the course of the year that were able to provoke substantial anxiety and fear, at least for the short-term. The year began with the Fiscal Cliff drama coming to an end and saw fear in the euro zone heat up after the Italian elections ended with a parliamentary deadlock and Cypriot banks triggered a joint EU/IMF bailout of Cyprus. The Boston Marathon bombings provided a jolt of terrorist fear in April and fears about Japan the future of Abenomics created huge volatility in the yen, with ripple effects felt across currency markets and in many related financial markets during May and June.

In the U.S., the Fed tapering scenarios dominated the investment landscape during the second half of the year and the debt ceiling crisis, government shutdown and entrenched bipartisan bickering cast many doubts about the potential for some huge self-inflicted wounds.

In the end, the SPX set 44 new all-time closing highs in 2013 and the VIX ended the year almost 24% below where it finished in 2012, though the Fiscal Cliff was responsible for most of that gap.

[source(s): StockCharts.com. VIX and More]

So far 2014 looks more interesting from a volatility perspective, but the year is young and the volatility story is always one of surprises in the form of swans with dark gray plumage.

Related posts:

Disclosure(s): none

Friday, June 14, 2013

Using DXJ to Monitor Developments in Japanese Equities, Currency and Risk

Since Tuesday’s The Currency Carry Trade, DBV and Risk clearly resonated with quite a few investors who are struggling to put their arms around what is going on in Japan and what the implications are for U.S. equities and other asset classes, I thought I would follow up today by focusing attention on an important ETP that can be used as an indicator or for speculation and hedging: the WisdomTree Japan Hedged Equity Fund (DXJ).

As the name suggests, DXJ is designed to be long Japanese equities, with no exposure to fluctuations in the Japanese yen, due to hedging of the currency. As WisdomTree puts it:

“The Fund employs an investment approach designed to track the performance of the WisdomTree Japan Hedged Equity Index. The Index and the Fund are designed to provide exposure to equity securities in Japan, while at the same time hedging exposure to fluctuations between the value of the U.S. dollar and the Japanese yen. The Index and the Fund seek to track the performance of equity securities in Japan that is attributable solely to stock prices without the effect of currency fluctuations.”

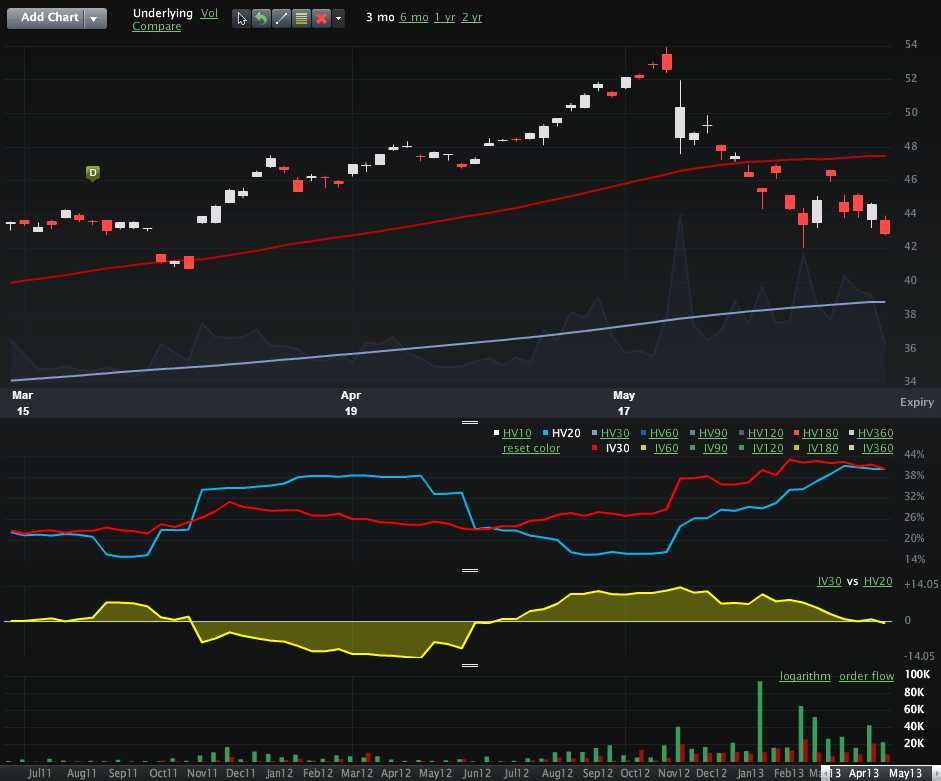
While DXJ was launched back on June 16, 2006, it was not until January 15, 2013 that options began trading on this product. The introduction of options is particularly notable in that while DXJ’s price provides an aggregated view of Japanese equities net of currency fluctuations, one can also use the implied volatility data from the options prices to determine how market participants see the risk and uncertainty in currency-hedged Japanese equities going forward. The chart below shows a three-month view of DXJ, with 30-day implied volatility (red line) remaining above 20-day historical volatility (blue line) for the past five weeks, though these numbers have converged this week. Not surprisingly, options volume has picked up substantially in DXJ as of late and there has been a bullish bias (calls = green, puts = red) in that volume. What I find even more interesting, however, is that implied volatility in DXJ appears to have peaked on June 5th.

With USD/JSP breaking below 94 earlier today, clearly there is a great deal of volatility in the yen that is being hedged away by DXJ. If one were to be interested in buying Japanese equities on the dip and also wish to eliminate the currency exposure found in the likes of EWJ, then DXJ is an alternative worth considering.

On the other hand, if one is interested in monitoring Japanese equities and currency movements in one issue and/or tracking the market’s assessment of risk and uncertainty (via implied volatility), DXJ could certainly be a useful tool for those purposes as well.

[source(s): LivevolPro.com]

Related posts:

Disclosure(s): long DXJ at time of writing; Livevol is an advertiser on VIXandMore

Tuesday, June 11, 2013

The Currency Carry Trade, DBV and Risk

Anyone who has been active in the financial markets during the past five years knows that there are many types of risk, many ways to think about and measure risk, and invariably some risks lurking around the next corner that many of us have never bothered to contemplate. Most investors tend to focus their attention on equities and therefore have a tendency to think in terms of the CBOE Volatility Index (VIX) and use that number to evaluate the relative level of risk, uncertainty or perhaps fear in the markets. That being said, during the past few years, almost everyone has become conversant in such topics as credit default swaps, the TED spread, the LIBOR-OIS spread, bank capital ratios and a whole host of concepts and statistics which were not on their radar in 2007.

For a more holistic approach to evaluating risk, there is always the St. Louis Fed’s Financial Stress Index, which is one example of an attempt to aggregate a variety of risk factors (18 in all) related to economic and financial matters into a single risk index.

One aspect of market risk that many investors continue to struggle with is the currency carry trade. If the daily movements of the dollar are relatively unimportant for those interested in buying and selling stocks that are primarily based in the U.S., then it is relatively easy for most investors to conclude that the gyrations of the Japanese yen (FXY) or Australian dollar (FXA) can be dismissed as much less important than those of the dollar. Unfortunately, this is not always the case. It turns out that many investors, particularly large institutional ones, have an appetite for the currency carry trade, in which one borrows in a currency where interest rates are low and uses the proceeds to buy assets in a currency where interest rates are higher. With Japan’s central bank targeting interest rates of 0.1% and the Reserve Bank of Australia recently cutting its base rate to 2.75%, the carry trade is structured as an interest rate differential trade in which an investor can borrow in yen and then buy Australian bonds, with profitability determined by the net interest rate differential plus or minus any fluctuation in the exchange rate.

Naturally some more aggressive investors prefer to use the yen as a funding currency for the purchase of assets other than bonds, including U.S. stocks. The problem for investors in U.S. stocks is that when the yen appreciates sharply – as it did on Monday and Thursday of last week, as well as during today’s session – traders with short yen positions who are victimized by a short squeeze will be subject to margin calls and/or forced liquidations, which means that not only are they covering their short yen positions, but they are also selling any long positions in U.S. equities as both legs are unwound. For this reason, when the yen carry trade is in favor, U.S. equities tend to move in the opposite direction of the yen. Traders can monitor the strength of the yen by following the USD/JPY currency cross or the Japanese yen ETF, FXY.

An alternative to focusing entirely on the yen is to monitor the PowerShares DB G10 Currency Harvest Fund (DBV), which, as PowerShares indicates, “is composed of currency futures contracts on certain G10 currencies and is designed to exploit the trend that currencies associated with relatively high interest rates, on average, tend to rise in value relative to currencies associated with relatively low interest rates. The G10 currency universe from which the Index selects currently includes U.S. dollars, euros, Japanese yen, Canadian dollars, Swiss francs, British pounds, Australian dollars, New Zealand dollars, Norwegian krone and Swedish krona.”

In other words, DBV is a carry trade ETF that is short three currencies and long three currencies at all times, updating these holdings on a quarterly basis. The ETF is currently short the Swiss franc, the euro and the yen, with long positions in the Australian dollar, the Norwegian krone and the New Zealand dollar.

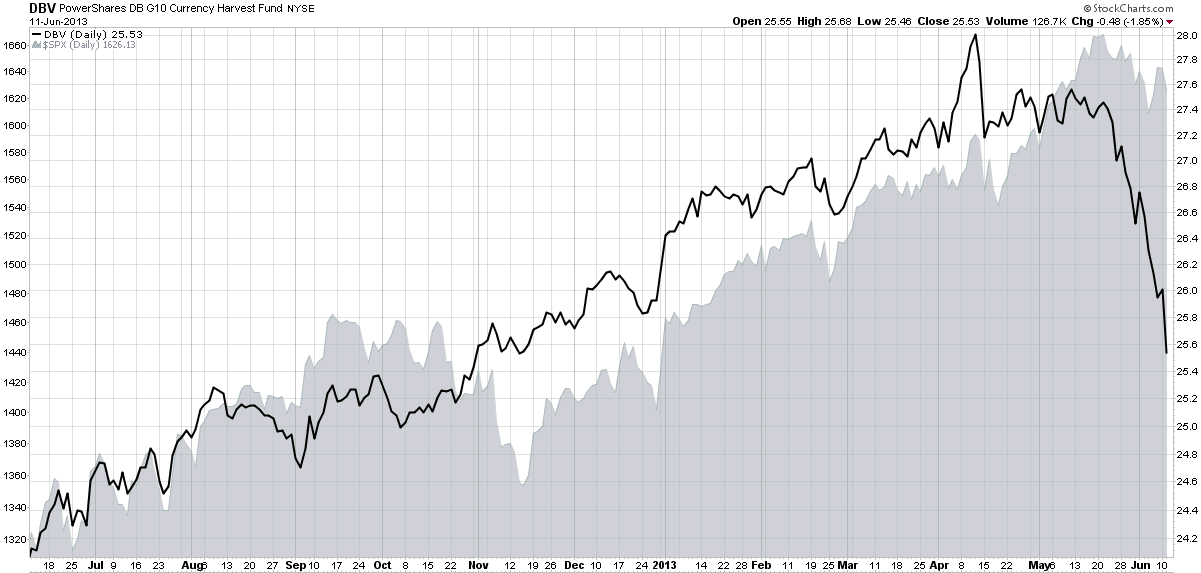
As the chart below shows, DBV has been tracking the S&P 500 index quite closely for most of the past year, but that relationship has recently broken down as DBV has plummeted while the SPX has experienced only a mild pullback. Going forward, investors should strongly consider keeping an eye on the USD/JPY cross, the FXY ETF (which is optionable) and also DBV, which provides a much broader picture of the overall carry trade – and can also serve as a proxy for the risk this trade can pose to stocks.

[In addition to the products referenced above, note that there is a currency carry trade ETF that is similar to DBV, the iPath Optimized Currency Carry ETN (ICI), but this product has considerably less liquidity.]

[source(s): StockCharts.com]

Related posts:

Disclosure(s): none

DISCLAIMER: "VIX®" is a trademark of Chicago Board Options Exchange, Incorporated. Chicago Board Options Exchange, Incorporated is not affiliated with this website or this website's owner's or operators. CBOE assumes no responsibility for the accuracy or completeness or any other aspect of any content posted on this website by its operator or any third party. All content on this site is provided for informational and entertainment purposes only and is not intended as advice to buy or sell any securities. Stocks are difficult to trade; options are even harder. When it comes to VIX derivatives, don't fall into the trap of thinking that just because you can ride a horse, you can ride an alligator. Please do your own homework and accept full responsibility for any investment decisions you make. No content on this site can be used for commercial purposes without the prior written permission of the author. Copyright © 2007-2023 Bill Luby. All rights reserved.
 
Web Analytics