Showing posts with label dollar. Show all posts

Wednesday, May 18, 2016

Economic Data Surprise Index Shows Continued Weakness

Today we get another glimpse into the behind-the-scenes machinations of the “data dependent” Federal Open Market Committee (FOMC) with the release of the minutes from the April 26-27 meeting.

While the Fed has a dual mandate of maximum employment and price stability, lately there has been considerable discussion about the how much the Fed should let global considerations factor into Fed policy.  Clearly, the pace of economic growth in China or the stability of euro zone has a significant downstream effect on economic activity in the United States.  Additionally, with 48% of revenues from the S&P 500 companies coming from international markets, policy formulation in an increasingly interconnected global economy is becoming more complicated with each advance in technology, communications and logistics.

Given this backdrop, just how does the data look?  For the past seven years I have been publishing an economic data surprise index that aggregates U.S. economic data relative to consensus expectations across areas such as employment, the consumer, housing/construction, manufacturing and inflation.  The chart below aggregates data across all these areas and shows data peaking relative to expectations during October 2014.  Since that peak, however, economic data relative to expectations deteriorated sharply, falling to an all-time low during the middle of January 2016 that was matched again at the end of last month. 


[source(s):  VIX and More]

If the Fed is indeed data dependent, then there is no avoiding the conclusion that aggregate data relative to expectations has been a disaster for the past 1 ½ months.  There are some signs of stability forming in the current environment and clearly the strength of the dollar and the price of crude oil will have a great deal to say about economic data going forward.  Then again, international events such as the Brexit vote and the evolution of negative interest rate policies of central banks across the globe may trump all domestic U.S. economic data.

[Readers who are interested in more information on the component data included in this graphic and the methodology used are encouraged to check out the links below. For those seeking more details on the specific economic data releases which are part of my aggregate data calculations, check out Chart of the Week: The Year in Economic Data (2010).]


Related posts:


Disclosure(s): none

Tuesday, June 11, 2013

The Currency Carry Trade, DBV and Risk

Anyone who has been active in the financial markets during the past five years knows that there are many types of risk, many ways to think about and measure risk, and invariably some risks lurking around the next corner that many of us have never bothered to contemplate. Most investors tend to focus their attention on equities and therefore have a tendency to think in terms of the CBOE Volatility Index (VIX) and use that number to evaluate the relative level of risk, uncertainty or perhaps fear in the markets. That being said, during the past few years, almost everyone has become conversant in such topics as credit default swaps, the TED spread, the LIBOR-OIS spread, bank capital ratios and a whole host of concepts and statistics which were not on their radar in 2007.

For a more holistic approach to evaluating risk, there is always the St. Louis Fed’s Financial Stress Index, which is one example of an attempt to aggregate a variety of risk factors (18 in all) related to economic and financial matters into a single risk index.

One aspect of market risk that many investors continue to struggle with is the currency carry trade. If the daily movements of the dollar are relatively unimportant for those interested in buying and selling stocks that are primarily based in the U.S., then it is relatively easy for most investors to conclude that the gyrations of the Japanese yen (FXY) or Australian dollar (FXA) can be dismissed as much less important than those of the dollar. Unfortunately, this is not always the case. It turns out that many investors, particularly large institutional ones, have an appetite for the currency carry trade, in which one borrows in a currency where interest rates are low and uses the proceeds to buy assets in a currency where interest rates are higher. With Japan’s central bank targeting interest rates of 0.1% and the Reserve Bank of Australia recently cutting its base rate to 2.75%, the carry trade is structured as an interest rate differential trade in which an investor can borrow in yen and then buy Australian bonds, with profitability determined by the net interest rate differential plus or minus any fluctuation in the exchange rate.

Naturally some more aggressive investors prefer to use the yen as a funding currency for the purchase of assets other than bonds, including U.S. stocks. The problem for investors in U.S. stocks is that when the yen appreciates sharply – as it did on Monday and Thursday of last week, as well as during today’s session – traders with short yen positions who are victimized by a short squeeze will be subject to margin calls and/or forced liquidations, which means that not only are they covering their short yen positions, but they are also selling any long positions in U.S. equities as both legs are unwound. For this reason, when the yen carry trade is in favor, U.S. equities tend to move in the opposite direction of the yen. Traders can monitor the strength of the yen by following the USD/JPY currency cross or the Japanese yen ETF, FXY.

An alternative to focusing entirely on the yen is to monitor the PowerShares DB G10 Currency Harvest Fund (DBV), which, as PowerShares indicates, “is composed of currency futures contracts on certain G10 currencies and is designed to exploit the trend that currencies associated with relatively high interest rates, on average, tend to rise in value relative to currencies associated with relatively low interest rates. The G10 currency universe from which the Index selects currently includes U.S. dollars, euros, Japanese yen, Canadian dollars, Swiss francs, British pounds, Australian dollars, New Zealand dollars, Norwegian krone and Swedish krona.”

In other words, DBV is a carry trade ETF that is short three currencies and long three currencies at all times, updating these holdings on a quarterly basis. The ETF is currently short the Swiss franc, the euro and the yen, with long positions in the Australian dollar, the Norwegian krone and the New Zealand dollar.

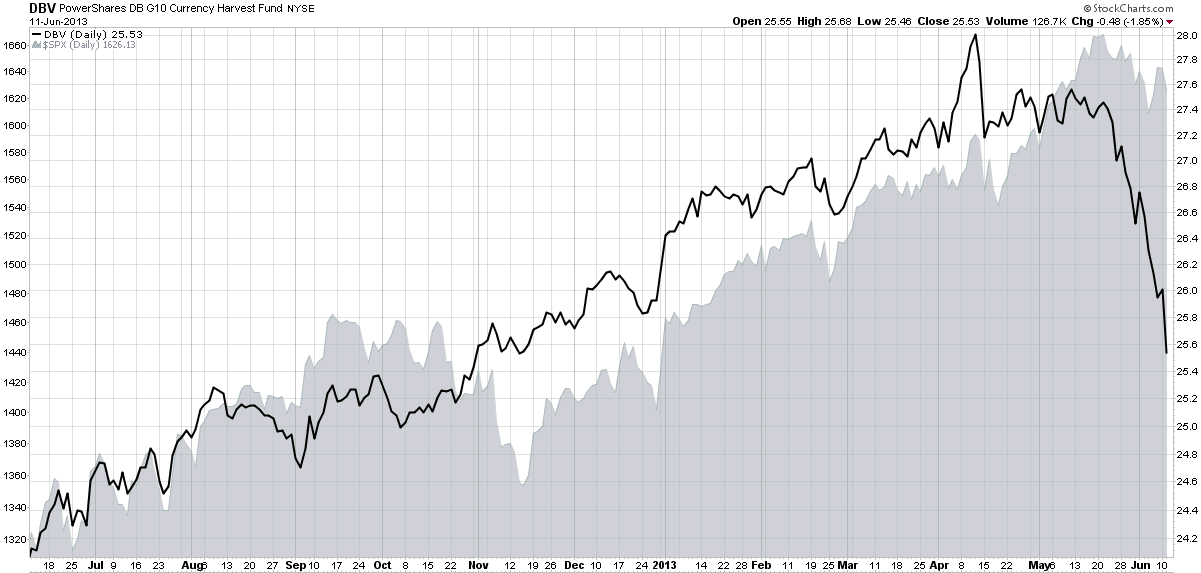
As the chart below shows, DBV has been tracking the S&P 500 index quite closely for most of the past year, but that relationship has recently broken down as DBV has plummeted while the SPX has experienced only a mild pullback. Going forward, investors should strongly consider keeping an eye on the USD/JPY cross, the FXY ETF (which is optionable) and also DBV, which provides a much broader picture of the overall carry trade – and can also serve as a proxy for the risk this trade can pose to stocks.

[In addition to the products referenced above, note that there is a currency carry trade ETF that is similar to DBV, the iPath Optimized Currency Carry ETN (ICI), but this product has considerably less liquidity.]

[source(s): StockCharts.com]

Related posts:

Disclosure(s): none

Sunday, October 10, 2010

Chart of the Week: The Dollar and the SPX Since August 2008

If you have been using the dollar as one of your primary indicators, chances are it has been a good year or perhaps even a good several years.

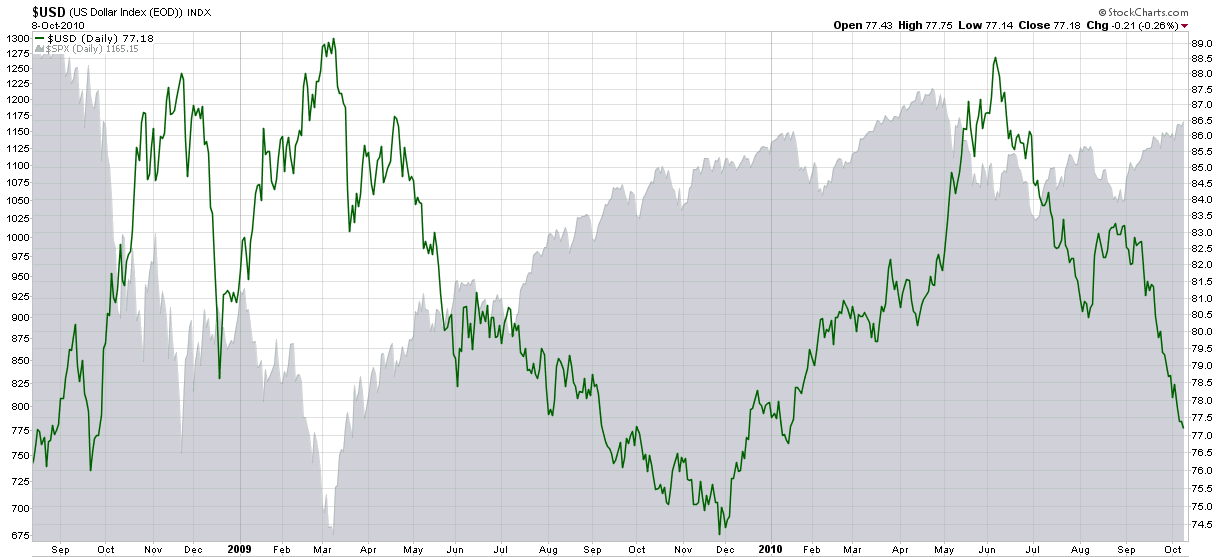
Stocks and the dollar do not always move in opposite directions, but for the better part of the last two years or so they have been doing just that, as the chart of the week below shows.

Note that the recent rise in stocks since the beginning of September has coincided with a declining dollar that has lost value in 15 of the last 18 weeks.

A weaker dollar has a number of influences on stocks, but the most notable is that it makes products and services cheaper in foreign markets. Some sectors benefit more than others. Heavy equipment and materials companies are beneficiaries of a weaker dollar, as is manufacturing in general. Technology is also a sector that is heavily dependent upon exports.

For now at least, the dollar is one of the strongest factors acting on stocks and commodities.

Related posts:


[source: StockCharts.com]

Disclosure(s): none

Sunday, December 20, 2009

Chart of the Week: Dollar Approaching Resistance on Weekly Chart?

Try as I may to find something other than the dollar to highlight in chart of the week, I find the dollar’s story to be too compelling to overlook. Also, to the extent that this weekly chart is supposed to reflect an issue that I have been contemplating at some length as of late, I see the dollar as one of the key elements of the 2010 investment puzzle.

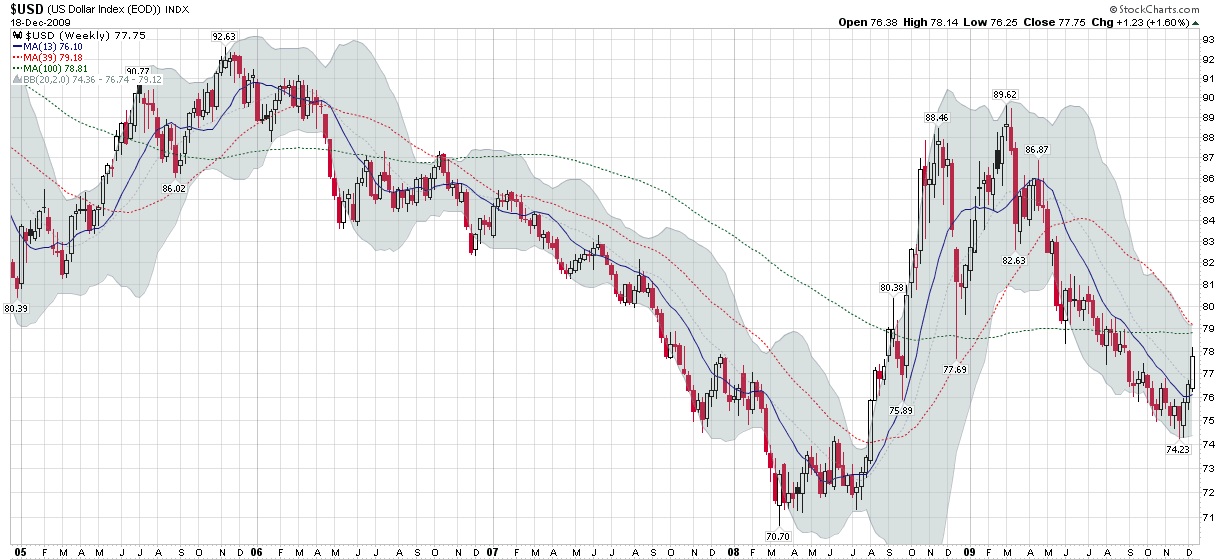
In order to get a better sense of the dollar, this week’s chart of the week looks at five years of weekly bars in the dollar index, which compares the dollar to a weighted average of a basket of foreign currencies that includes the euro, Japanese yen, British pound, Canadian dollar, Swedish krona and Swiss franc. Of these currencies, the euro has by far the largest weighting in the basket at approximately 57.6%. For this reason, concerns about Dubai, Greece and Spain have not only significantly weakened the euro, but because of the euro’s weighting, have had a strong bullish effect on the dollar index.

The chart below shows that the 79 level in the dollar index represents resistance in the form of converging 39 and 100 week moving averages. On startling feature in the chart is the 100 week moving average, which has held steadfast in the high 78s for 16 straight months, even as the dollar index has fluctuated wildly during the financial crisis. Should the dollar close above 79 and take out both moving averages, I would have to consider it back on a bullish trajectory. For now, however, I am content to count the recent move as a technical bounce that has resulted from a series of threats to the European economy and its currency.

For more on related subjects, readers are encouraged to check out:

[source: StockCharts]

Disclosure: none

Sunday, December 6, 2009

Chart of the Week: Dollar Rising?

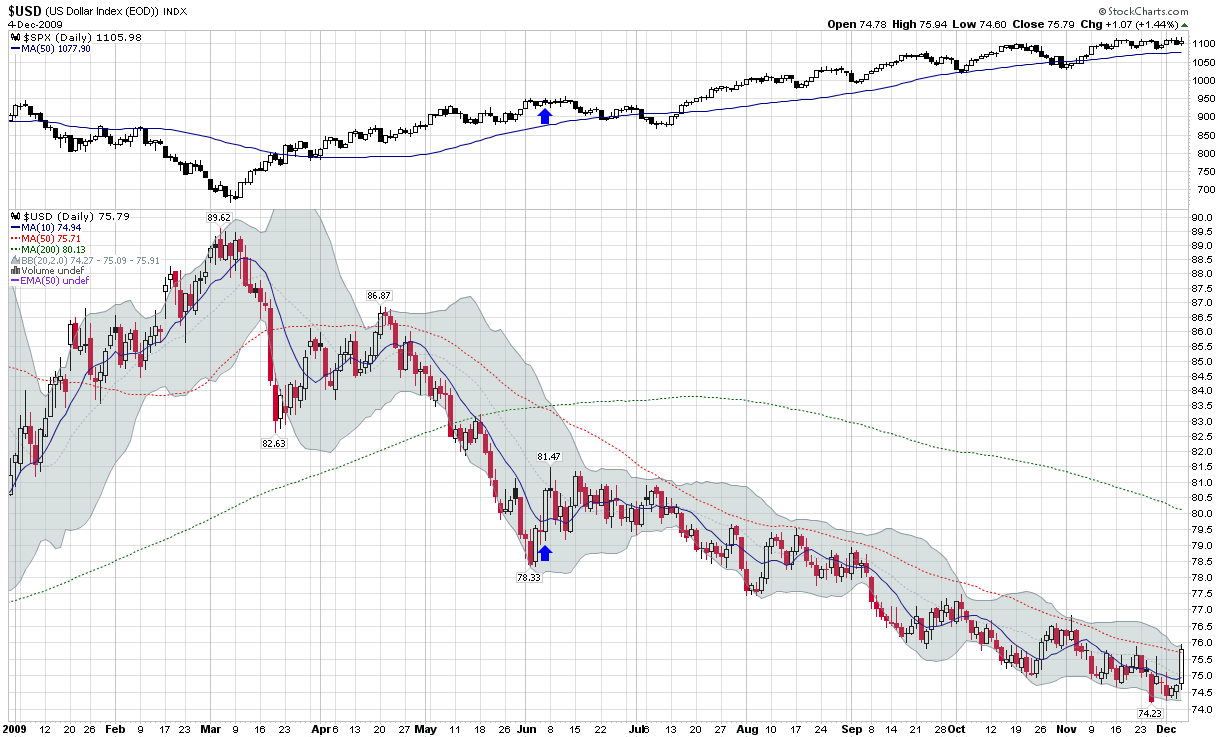
Friday was a reminder that the dollar will not go down every single day in an orderly, straight line fashion. In fact, there will be days when the dollar reverses sharply and sends traders who are short the currency scrambling to cover their positions, as was the case with Friday’s 1.44% gain.

In this week’s chart of the week below, I track the fall of the dollar and simultaneous rise in the S&P 500 index that began during the first week in March. Since that time there has been only one day in which the dollar gained more than 1.44%. I have highlighted that day with blue arrows to underscore that while the prior large move in the dollar did precede a two week bounce in the currency and a four week selloff in stocks, it did not affect the underlying trend in either the dollar or stocks.

Of course it could be different this time around. For starters, the dollar closed above the 50 day moving average for the first time since mid-April. From a technical perspective, however, I would not tend to get excited about Friday’s rally until it leads to a higher high above 77 and a higher low above 75. For now at least, the current rally should be treated as just another opportunity for some new shorts to join the dollar carry trade party.

For more on the dollar, readers are encouraged to check out:

[source: StockCharts]

Disclosure: none

Sunday, May 24, 2009

Chart of the Week: Commodities and the Dollar

One of the market-moving stories of the week was a decision by Standard & Poor’s to lower their outlook for AAA-rated sovereign debt of the United Kingdom from stable to negative. This action caused ripples in the currency markets, with the dollar coming under pressure after investors such as Bill Gross of PIMCO expressed concerns about the mounting U.S. deficit and potential future risk to the AAA credit rating for U.S. debt.

By the end of the week the dollar was at a four month low against the euro and commodities were up sharply, partly because commodities are seen as an effective hedge against inflation.

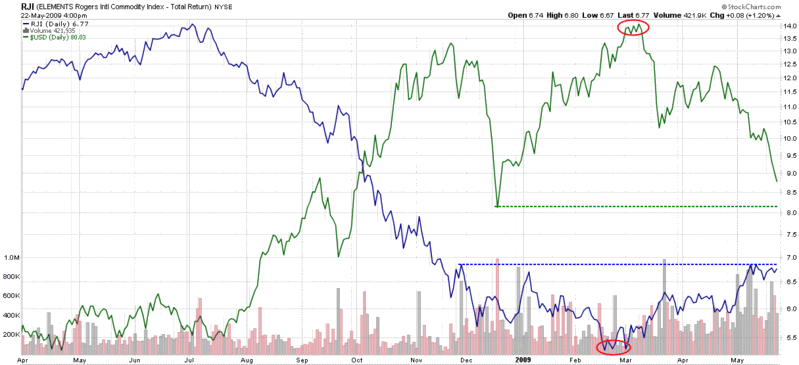
In the chart of the week below, I have captured a chart of the Rogers International Commodity Total Return Index ETF (RJI) versus the U.S. dollar. The chart shows that commodities formed a bottom in mid-February and have recently attracted buying in higher volumes.

Shortly after commodities bottomed, the dollar peaked and has experienced several sharp moves down. The drop in the dollar has helped to lift prices of dollar-denominated commodities and pushed money toward commodities as a potential inflationary hedge. During the course of the past three months, commodities have had two up trending periods, each of which was followed by a consolidation period. With the dollar breaking down and in danger of testing the December support level, commodities could be preparing for another upward leg soon.

[source: StockCharts]

Saturday, December 13, 2008

Chart of the Week: U.S. Dollar Reverses Down

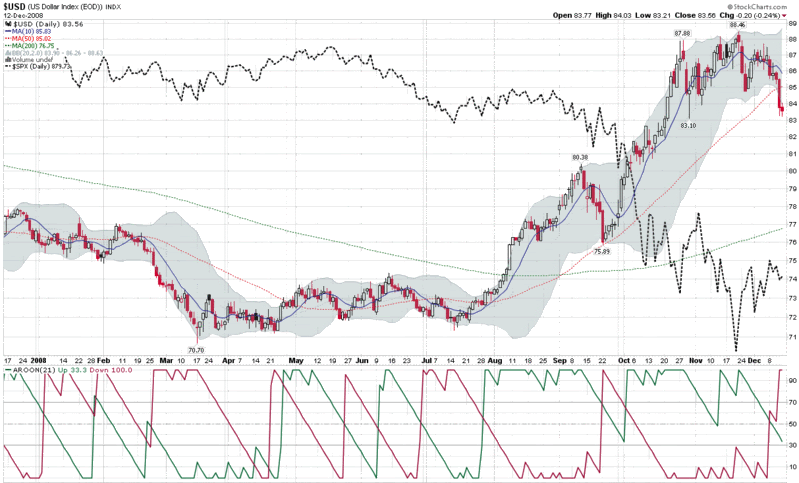
There were many strong candidates for the chart of the week, but this week’s honor goes to the U.S. Dollar, which saw its largest one week drop in percentage terms in at least 25 years.

As the chart below shows, the dollar has been negatively correlated to stocks for the past five months or so. Historically, a falling dollar has generally not been positive for stocks. It will, however, provide some support for exporters and enhance demand for commodities that are quoted in dollars across the globe.

For the most part, the strength of the dollar usually reflects traders’ opinions about the strength of the U.S. economy relative to economies associated with the other major currencies. When the dollar was rising, therefore, it was not necessarily a vote of confidence in the U.S. economy as much as it reflected a concern that other nations may be in an even more difficult situation. Now with the mushrooming U.S. debt on top of an already severe economic crisis, the prospects for the U.S. economy relative to that of some of other global economies is being reevaluated from one of the strongest to perhaps only slightly better than average.

The dollar appreciated approximately 23% from July to November. This week the dollar moved below its 50 day moving average for the first time since the July bullish move again. Trend indicators such as the Aroon are starting to reflect a reversal in trend; expect trend-following systems to be short the dollar as the new trend becomes more pronounced.

Do not be surprised to see half of the 23% gain disappear in the next few months.

[source: StockCharts, VIX and More]

Friday, August 15, 2008

The Dollar Is UUP

I know there are many stock pickers out there who never thought they would put on commodity positions until a spate of commodity-related ETFs began appearing. Perhaps the next frontier for these former “equities only” investors is currencies.

Clearly currencies aren’t for everyone and in some respects they are the ultimate zero-sum game, but if anyone doubted their importance, just look how the markets have changed since the dollar reversed its course and started moving up a month ago.

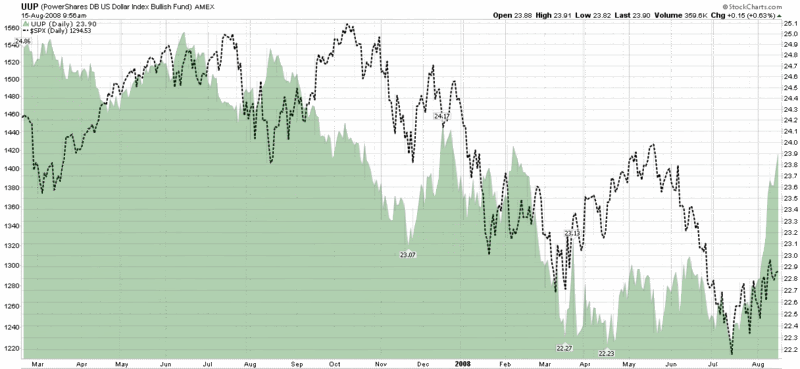
The chart below shows the UUP ETF, the dollar ETF whose formal name is the PowerShares DB US Dollar Bullish Fund. This ETF is based on the Deutsche Bank Long US Dollar Index Futures Index, where futures contracts are designed to replicate the performance of being long or short the US Dollar against the euro, Japanese yen, British pound, Canadian dollar, Swedish krona and Swiss franc. For more details, a good place to start is the UUP fact sheet.

It is important to note that while the dollar has made a substantial move over the course of the past month and is now breaking out of a three year downward channel, the dollar’s move is more the result of increasing concerns about foreign economies than it is about strength in the U.S. economy. The bottom line: the U.S. economic outlook has not improved over the past month; instead, things have taken on an even gloomier tone overseas.

Finally, I would be remiss in not pointing out that on balance, U.S. equities tend to react favorably to a rising dollar. The chart of the UUP shows the dollar’s rally off of the July low buffeting the S&P 500 index.

Tuesday, August 12, 2008

An Eight Year View of the Dollar

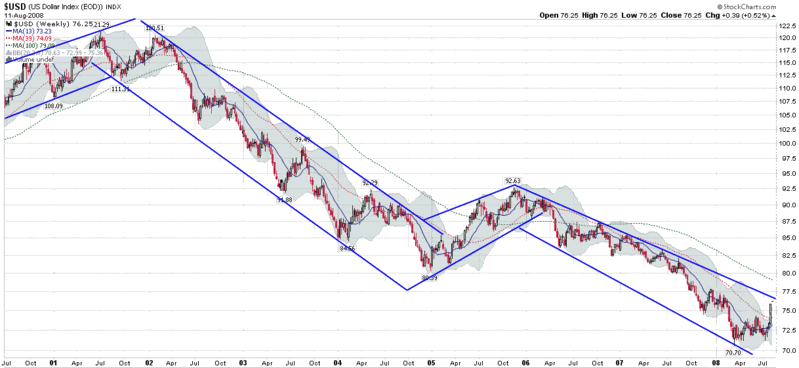
Last week’s 3.3% gain in the dollar was the biggest weekly gain since the dollar peaked some seven years ago.

The chart below chronicles the decline in the dollar over the course of two long downward legs, the first leg running from 2001-2004 and the most recent leg from the end of 2005 to the present.

From a technical perspective, it is still too early to say that the dollar has begun a decisive new uptrend. Since 2001, there have been quite a few 3-4 month countertrend rallies and one full year (2005) in which the dollar looked to be making a new bullish leg before reverting back to the long-term downtrend.

That being said, the dollar is nearing the top of its trading channel for the first time in over a year. Looking at macroeconomic and other factors, I believe that a channel breakout is the most likely scenario, which will bring a new technical twist to currencies, commodities, bonds and equities.

DISCLAIMER: "VIX®" is a trademark of Chicago Board Options Exchange, Incorporated. Chicago Board Options Exchange, Incorporated is not affiliated with this website or this website's owner's or operators. CBOE assumes no responsibility for the accuracy or completeness or any other aspect of any content posted on this website by its operator or any third party. All content on this site is provided for informational and entertainment purposes only and is not intended as advice to buy or sell any securities. Stocks are difficult to trade; options are even harder. When it comes to VIX derivatives, don't fall into the trap of thinking that just because you can ride a horse, you can ride an alligator. Please do your own homework and accept full responsibility for any investment decisions you make. No content on this site can be used for commercial purposes without the prior written permission of the author. Copyright © 2007-2023 Bill Luby. All rights reserved.
 
Web Analytics