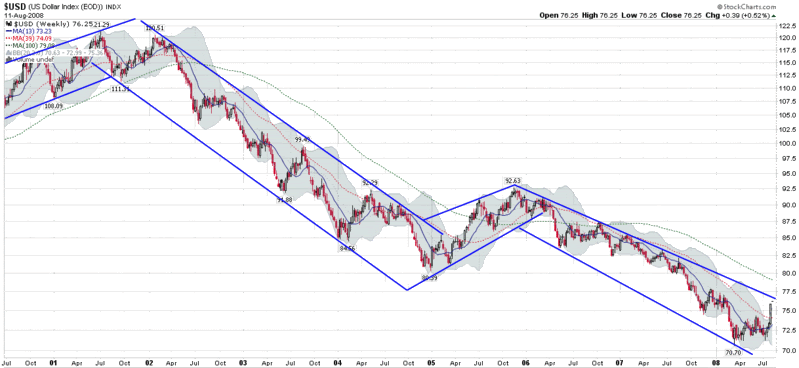
An Eight Year View of the Dollar
Last week’s 3.3% gain in the dollar was the biggest weekly gain since the dollar peaked some seven years ago.
The chart below chronicles the decline in the dollar over the course of two long downward legs, the first leg running from 2001-2004 and the most recent leg from the end of 2005 to the present.
From a technical perspective, it is still too early to say that the dollar has begun a decisive new uptrend. Since 2001, there have been quite a few 3-4 month countertrend rallies and one full year (2005) in which the dollar looked to be making a new bullish leg before reverting back to the long-term downtrend.
That being said, the dollar is nearing the top of its trading channel for the first time in over a year. Looking at macroeconomic and other factors, I believe that a channel breakout is the most likely scenario, which will bring a new technical twist to currencies, commodities, bonds and equities.


5 comments:
Just after posting this, I see Declan Fallond (whose analysis is always worth reading) has a different technical take on the dollar, with an opinion that the dollar has already broken out.
Get the details at Dollar Rally - How Far?
looking at the graph, if a mirror move play out, shouldn't the dollar index go down to about 50? first leg from 120 to 80 =40 second leg from 90-40=50
I'm with Fallond.
The longer term hasn't broken yet, but I think we have enough evidence in the short term that the long term will be taken out and we will move higher in the dollar going forward. Which will be good for US equities bad for emerging markets.
Thanks for the link Bill,
Each resistance break gives a notch to the bull column. Your 2-year channel looks to be applying the resistance which should morph into some test of the 200-day MA or faster moving 20-day MA - whichever comes first.
But it's an interesting turn for the dollar.
DJF
Funny we both posted this at the same time. I rarely mention the dollar....
Post a Comment