Energy Sector Weekly Chart and Support Levels
There has been a lot of wild action in the energy sector as of late, with much of it favoring the bears for the first time in a while.
Within the last hour, the US Energy Information Administration reported that crude oil inventories increased by 1.7 million barrels last week, compared to a consensus estimate of a 1.2 million decrease. This announcement has put considerable pressure on crude oil prices once again in morning trading, with the commodity now down 20% from the high of about a month ago. Not surprisingly, energy sector stocks are falling in tandem with crude.
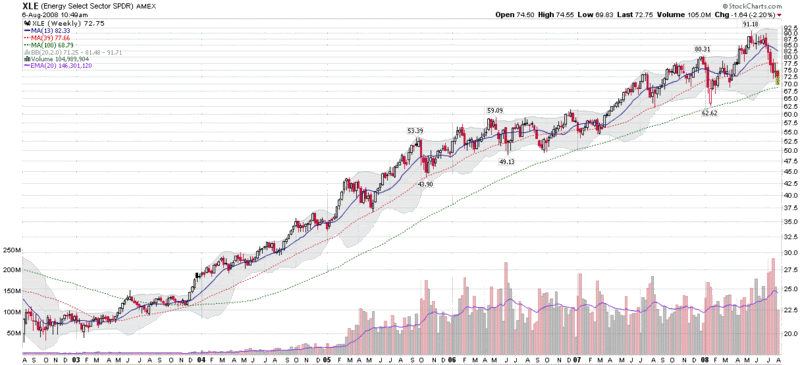
A look at the weekly chart of XLE, the de facto energy sector ETF, shows that the recent correction in energy stocks is comparable to what transpired at the beginning of the year. In fact, XLE bounced off of the 100 week simple moving average in January and may have done so again yesterday, when it touched 69.83 – just above the current 100 week SMA of 68.79.
I believe there is a good chance XLE made an intermediate-term bottom yesterday, but it will take a convincing rebound in the second half of today’s session for me to want to act on that opinion.


4 comments:
Bill
Is there a specific rational behind your bullish stance here? Volatility data, etc?
I made a recent post on my blog about crude oil and USO showing that this correction has significantly exceeded (on a percentage basis) other corrections over the last couple years of bull market. The same can be said for XLE as well. Coming off a major top, I don't believe this has bullish implications.
Wishing you the best,
Pete Birchler
http://stockmarketalchemy.blogspot.com/2008/07/update-on-oil-market-and-uso-chart.html
Hi Peter,
Today may turn out to be an interesting test for energy, as those early gains evaporated very quickly.
Your point is well made. The main impetus for my conclusion (which I did not include in my post), is indeed based on volatility. One of my favorite methods for evaluating ETFs combines historical volatility and IV and in the case of XLE suggested a ST and possibly IT low.
IMO, it is too early to say whether this will be a pullback to the long-term trend (the point of my post) or the start of a new trend (the idea you are putting forth), so my time frame for the trade is only about two weeks.
I hope this helps.
Cheers,
-Bill
Adding to Bill's volatility bullish case, oil is hitting some key fibonnaci retracements. For the USO, we have touched the 61.8% retracement of March low to July high (79.40 to 119.17), which is 94.59. We have also come close to retracing 50% of February low to March high (68.57 to 119.17), which is 93.87. Full stochastic is at 9 on the daily. We also have a bullish divergence on MACD of 60-minute chart.
Great Blog Bill!!
Regards,
Bisco
Hey fellow investors! Exciting times in the market with Bill's volatility play and the intriguing oil dynamics. Adding more spice to the mix, check out the USO's dance with Fibonacci retracements – hitting that 61.8% from March low to July high at 94.59 and a close call with the 50% from February to March at 93.87. The full stochastic on the daily is at a mere 9, signaling potential upward movement. And let's not forget the cherry on top – a bullish MACD divergence on the 60-minute chart. Now, shifting gears a bit, who else is keeping an eye on opportunities in 2024, especially with the buzz around the Canada Study Visa?
Post a Comment