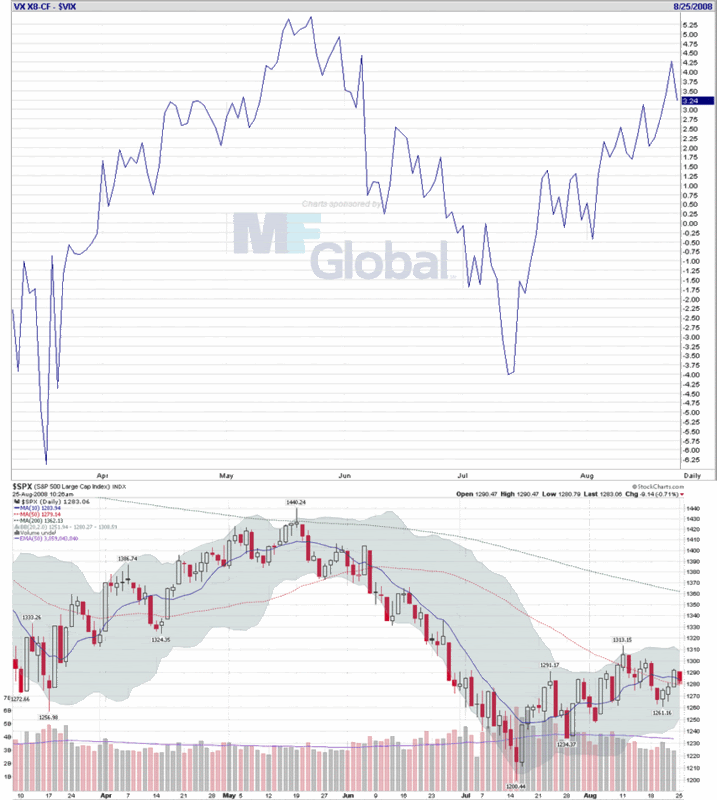
SPX and VIX Three Month Futures Premium
Friday’s post, VIX Slips Below 19, appears to have raised some interest in VIX futures premiums (or “premia” for the more scholarly inclined).
Looking three months out, the VIX November 2008 futures contract (VIX/X8) has been open since November 2007 and reached a settlement high of 26.25 on March 14, 2008, just before the bottom of the equities market. By contrast, the all-time settlement low for the VIX November futures contract was 21.35 on May 2, 2008, a month and a half after the markets moved off of the March bottom and about two weeks before the markets topped. These VIX futures peaks and valleys just happened to precede important intermediate-term market tops and bottoms and may have hinted that a reversal was coming soon, in a manner similar to that of the VIX:VXV ratio.
Keep in mind that the VIX:VXV ratio is a ratio of the VIX (CBOE [S&P 500 1-Month] Volatility Index) to the VXV (CBOE S&P 500 3-Month Volatility Index). The six month chart below (courtesy of FutureSource.com and StockCharts.com) captures the difference (i.e., "futures premium") between the VIX November 2008 futures (VIX/X8) and the VIX index or cash/spot VIX. As the chart demonstrates, highs and lows in the VIX futures premium also coincide with tops and bottoms in the SPX.
Whether you are dividing or subtracting VIX futures and the VIX index, I feel obliged to offer a caution that a simplistic analysis of futures premiums can lead to some bad trading decisions. Like many sentiment indicators, however, when VIX futures premiums reach extremes, these can be valuable signals for market timers.


8 comments:
you have lost me on what you are measuring on the VIX:VXN ratio. Can you help me understand?
Hi B^3,
The ratio in question is the VIX:VXV and it measures the VIX (30 day volatility expectations) against the VXV (essentially a 93 day version of the VIX).
For more information, you might want to check out:
The VIX, VXV and Volatility Expectations
The VIX:VXV Ratio
Catching Up On Reader Mail
Thinking About the VXV
I hope this helps.
Cheers,
-Bill
Bill,
concerning your chart and your statement As the chart demonstrates, highs and lows in the VIX futures premium also coincide with tops and bottoms in the SPX.:
If you'd substitute the futuresource chart with VX-X8-CF (VIX Nov'08) minus the *cash* VIX by the reverse chart of the *cash* VIX alone (e.g. $ONE:$VIX at stockcharts.com), you would see an identical chart with identical highs and lows. The reason is that in May the VX-X8 contract was 6 month out, and it's annualized 22-day historical volatility was something around 30%. Today it's something around 36% while the front month future has an annualized 22-day historical volatility around 63% while the *cash* VIX itself has an annualized volatility around 89%.
The more the future is out, the less is it's annualized historical volatility and it's correlation (and "delta" concerning any movement in the *cash* VIX) to the *cash* VIX and S&P 500.
The respective highs and lows in the VIX futures premium chart (or the reverse *cash* VIX chart) are therefore almost solely caused by the high correlation between the SPX and the *cash* VIX (including highs and lows).
It would be slightly different if you'd always (the means at any point in time) use the VIX front month future instead of a (Nov.'08) future which was 6 month out in May and is still 3 month out, because the front month future is much more volatile itself and any premium much more predictive (because it has a much higher trading volume and open interest, and one could see what market participants -especially large and commercial traders- are betting on).
The last time we saw such huge premiums between the *cash* VIX and the VIX front month future was the week after christmas last year, and it was the VIX front month future which was predictive for the future (negative) direction of the market.
As always I appreciate your comments and blog, and it is my pleasure -if wanted- to make a contribution from time to time.
Best regards
Frank
Bill,
The spread (or ratio) between spot and nearest futures is what commodity futures traders for over 100 years called "the basis". Now that we have all become financials traders we talk in different terms: contango etc.
"The basis" measures the willingness of the major commercials (farmers and grain elevator operators in grains) to hold or abhor product. It was said that one needed to understand "the basis" to trade successfully.
Now we need to know who the farmers and elevator operators are for SNP500 options volatility.
Tom D
The Government of Saskatchewan just published an informative outline of "the basis" for Sask canola and flax.
http://www.agriculture.gov.sk.ca/Default.aspx?DN=476cf052-7673-4387-aac1-b585a6e69d8b
For VIX I guess stock portolio managers would be akin to farmers/sellers and hedge funds would be akin to elevator operators/buyers.
As someone else suggested, subtracting the futures price from the current VIX, as is done for the basis in ag pricing, might show if anything other than simple carrying cost (interest rates) is being measured by or influenced in the difference. If the difference or basis varies over time some useful information may be gained.
Tom D
A last comment on this thread: the cobbled-together chart shows your "basis" chart of VIX, the top chart the constant 3 month forward Eurodollar price (100-price=rate) and the lower is "spot" VIX. Clearly the 90 day interest rate is a major part of the picture, as it is a component of the cost of hedging. File under "possible future projects":
http://screencast.com/t/9jgcj0Ch9
Thanks for the insights, Frank and Tom D. You two are excellent contributors here and I always appreciate it when you take the time to share your thinking.
Cheers,
-Bill
Bill..can you post a chart of the VIX November 2008 futures contract (VIX/X8)since it started trading through today if possible? It just hit $38.
Post a Comment