Thinking About the VXV
I have recently received a couple of inquiries about the new VXV, which I first mentioned just after the CBOE launched the product in mid-November.
In short, whereas the VIX measures the implied volatility of SPX options 30 days out, the VXV measures IV for options 3 months (93 days) out. For those who want to get into the details of the VXV, the best source is a 6 page “Index Description” PDF published by the CBOE. In this paper, I found the following comments to be of particular interest:
“VXV has tended to be less volatile than 1-month VIX. Since January 2002, the volatility of VXV daily returns has been 58.4% compared to 90.1% for VIX. The correlation between VXV and 1-month VIX during that time was 0.92, indicating a strong tendency to move together, but far from moving in lockstep.
Using VXV and VIX together provides useful insight into the term structure of SPX option implied volatility. The following chart shows VXV price movement along with a measure of the difference between the 3-month VXV and 1-month VIX. Since January 2002, VXV has been higher than VIX – reflecting an upward sloping term structure – 79% of the time. However, 21% of the time, especially when volatility spikes, VIX is greater than VXV – reflecting a downward sloping term structure.”
Even better, the CBOE lays out what dedicated VIX and More readers could probably already have guessed:
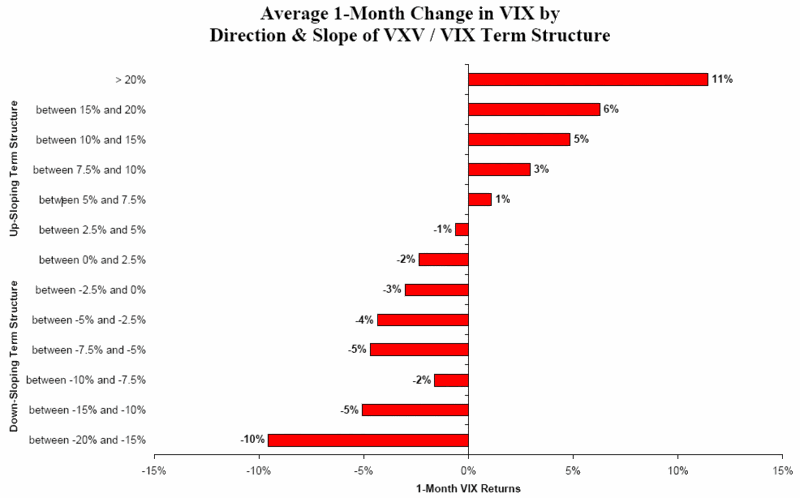
“The behavior of VXV relative to VIX illustrates the mean-reverting properties of volatility and suggests that the slope of the 1- to 3-month SPX implied volatility term structure could be used to predict future levels of near-term (1-month) implied volatility...
When the VXV / VIX term structure was sharply upward sloping; that is, 3-month VXV was higher than 1-month VIX by more than 10%, the average closing VIX level over the following 20 trading days was, on average, higher by at least 5%. Moreover, this effect became more pronounced as the slope of the term structure steepened. Conversely, when the slope of the VXV / VIX term structure was relatively flat (less than 5%) or downward sloping (VXV lower than VIX), VIX levels over the next month tended to be lower, on average.”
All this can be neatly summarized in a CBOE graphic:

Now that we are coming up in one month of VXV data, I will start talking about this most interesting index on a regular basis.


1 comments:
Cant wait for your research on the VXV, looks to be an important tool to add to the tool box.
You and IndexIndicators.com should get together about charting this useful VXV/VIX relationship. Looks like the extremes between the two are the most reliable indicators. How about a standard deviation chart similar to what indexindicators does??
We know VXV will normally be higher than VIX mostly because of predicting 3 months vol (which will include the all important expiration months) with VXV versus just 1 month for VIX, but extremes and SD moves could prove helpful in timing, allocation and position sizing.
Great work as usual, Bill!
Post a Comment