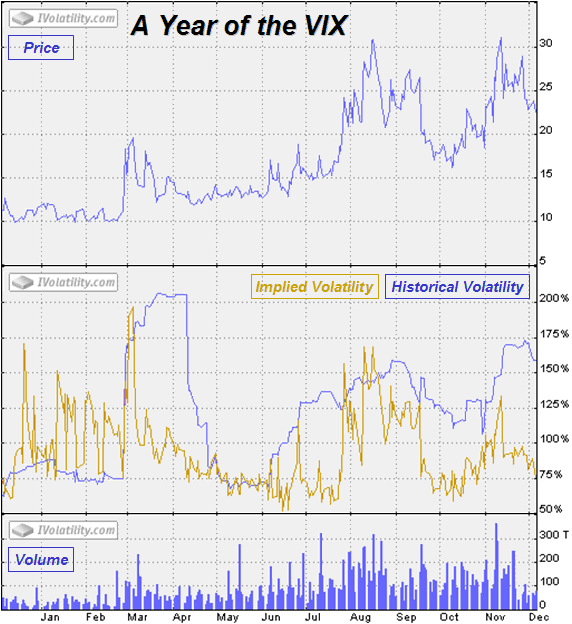
A Year of the VIX
It was one year ago today that I decided to download the VIX historical data from the CBOE, dump it into Excel, do some quick and dirty analysis, then make some sort of determination about whether I should expend any additional time and energy studying market volatility.
One year later I am pleased to have taken that initial step, made a decision to expand the scope of my research, and little by little begun to incorporate some new ideas into my trading. Along the way, of course, a blog was born to collect and archive my semi-random thought tangents. After the first of the year, I will sit down at the keyboard and see what I can do in terms of distilling some of my thinking that is appropriate for publication and putting it here in blog-sized pieces, perhaps even in a more orderly fashion than the blog has evolved. Maybe I’ll begin with something like “VIX 101: An Introduction” or “A Dozen Things Everyone Should Know About the VIX” and go from there. Comments and suggestions, as always, are welcome.
In the meantime, I thought it might be interesting to assemble in one graphic the three charts iVolatility has for the VIX. These are the one year charts of the VIX price, the implied and historical volatility of VIX options (meta volatility), as well as the VIX options volume. I find it interesting to observe, among other things, the relationship between the VIX, VIX IV and VIX options volume.


3 comments:
Is it because the VIX options are a derivative of a derivative that IV consistently looks cheap relative the HV? Not often you see an IV chart like that.
I really enjoy the interesting ways you use charts. The inverse VIX chart is brilliant.
Just curious, to me it looks like an inverse head and shoulder pattern from February on. Any thoughts?
Hi dowoper8tr,
An interesting question that I had not given much thought to until you raised it. My best guess is that most of large gaps between IV and HV are the result of a spike and mean reversion at work. While HV covers 30 days, most mean reversion happens in 10 days or less. To some extent the large IV-HV is a measure of that mean reversion.
Thanks for the comments on the inverse VIX chart. I think I'll use it more often.
John,
I don't see an inverse H&S at work, but maybe that's just a lack of imagination on my part. Feel free to spell it out if you wish.
Cheers,
-Bill
Post a Comment