The VIX:VXV Ratio
Yesterday I talked a little bit about what the CBOE has said about the VXV. Even though it is still early days, today I thought I would offer up a simple framework that might be useful for using the VXV as a timing tool.
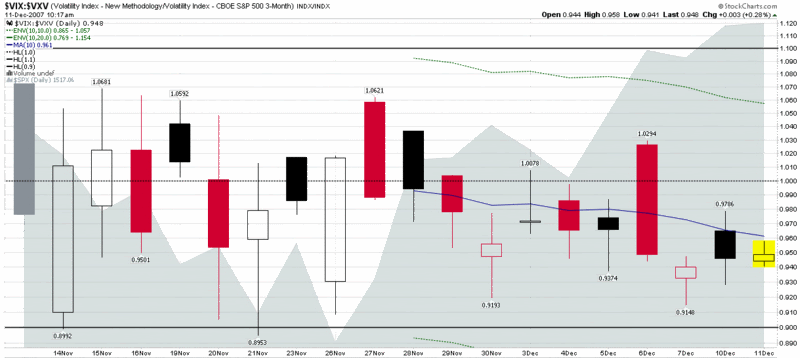
The chart below covers the first month of data from the VXV and calculates a ratio of the VIX to the VXV (the CBOE chart from yesterday chose to use the ratio of the VXV to the VIX, but I generally prefer to have the more volatile number in the numerator and the less volatile one in the denominator.)
I expect that the VIX to VXV ratio will make it easy to determine the extent to which the implied volatility on SPX options suggests investors expect volatility to rise or fall in the 30 day (VIX) to 93 day (VXV) time period. In addition to the 10 day simple moving average and 10% and 20% moving average envelopes, I have included three horizontal lines in the chart below. The dotted black line is set to 1.00 and indicates no expectations for a change in volatility over the 30 to 93 day time frame. The two solid black horizontal lines are set to 0.90 and 1.10 and are intended to be easy visual references to indicate when volatility is anticipated to change by at least 10% in that 30 to 93 day window.
The 10% level is somewhat arbitrary and largely dependent upon a desired signal to noise ratio, but it is supported by the CBOE data I highlighted yesterday and is consistent with much of my other research on the VIX. Just as is the case with VIX futures, I expect the VIX to have a tendency to fall and the markets to rise when the VIX:VXN ratio is above 1.10; and will look for the VIX to rise and the markets fall when the ratio is below 0.90, in classic mean reversion fashion.


0 comments:
Post a Comment