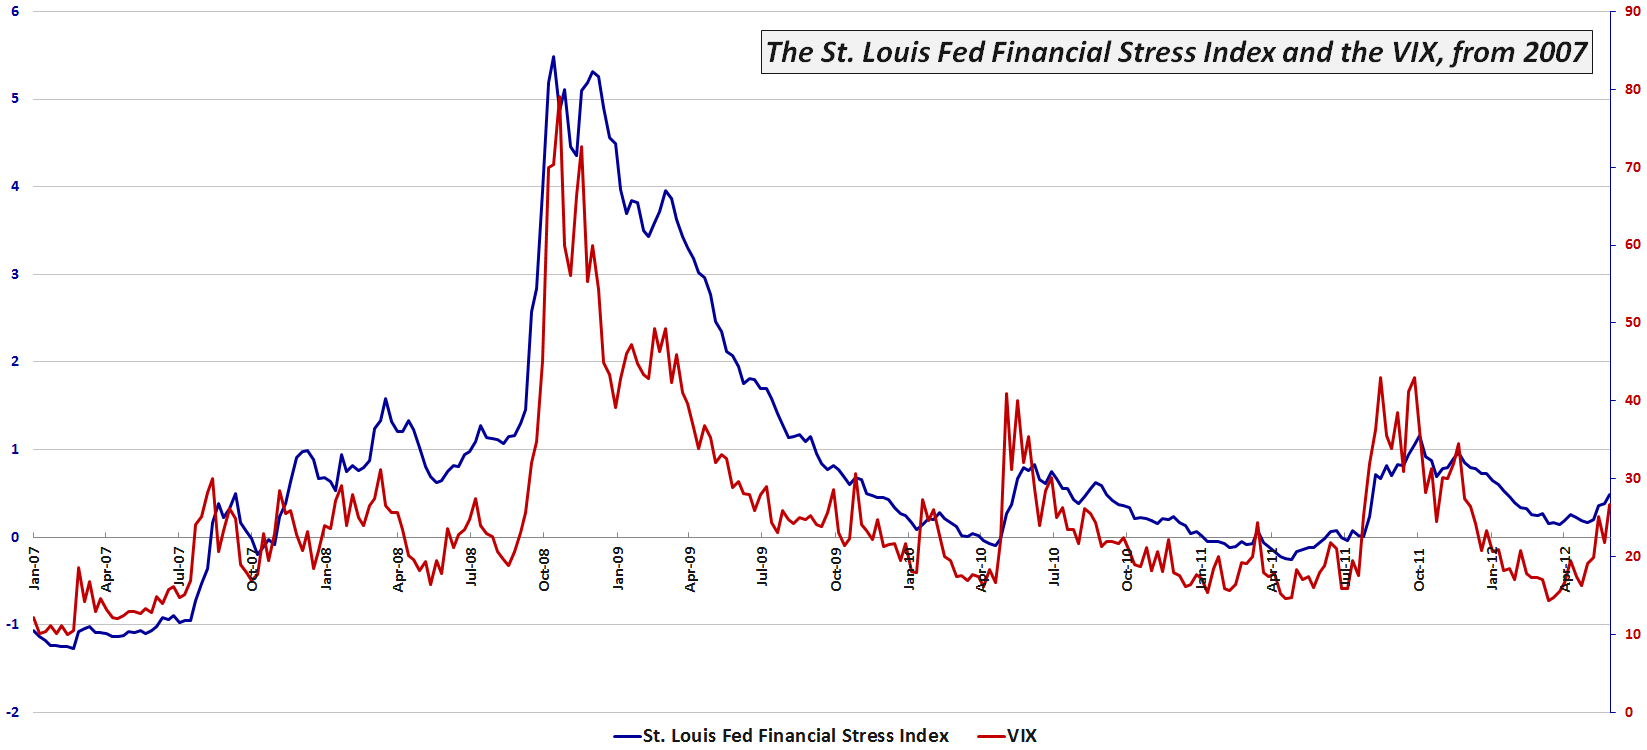
Chart of the Week: The St. Louis Fed’s Financial Stress Index and Market Risk
Determining the risk in the financial markets should get easier with more data, more measures and more experience navigating crisis environments, right? Not so fast.
Right now, for instance, the CBOE Volatility Index (yes, the VIX does have a formal name) is just a shade above its lifetime average, yet the yield on the 10-Year U.S. Treasury Note is just a week away from its all-time low. Granted the Fed has been distorting interest rates with Operation Twist and other policy initiatives, but it has only been in the last month or so that yields have dipped below 1.7%.
One broad-based tool for measuring risk in the financial markets and related institutions is the St. Louis Fed’s Financial Stress Index (which I refer to as the STLFSI), which has 18 component measures that include a variety of interest rate and yield spread data, as well as the VIX, measures of bond volatility and other data that are correlated with market stress.
This week’s chart of the week below shows the movements in the STLFSI and the VIX since the beginning of 2007. Note that for most of 2012 the VIX has been indicating much less risk and uncertainty than the STLFSI. Only since the middle of May have I observed the VIX rise to a relative level that is consistent with the STLFSI. As of last week, for instance the STLFSI was at the 79th percentile of its lifetime range, while the VIX was in its 82nd percentile. For the record, the divergence was widest in the middle of March, when the STLFSI had a 68th percentile reading, yet the VIX was mired in the 23rd percentile. Financial historians might also be interested to know that the mid-March divergence was the largest since August 2008…
For more information on the components of the STLFSI and the index’s long-term performance, check out an earlier post, St. Louis Fed’s Financial Stress Index, as well as some of the other posts linked below.
Related posts:
- VIX and St. Louis Fed’s Financial Stress Index Moving in Concert
- Zooming in on the St. Louis Fed’s Financial Stress Index
- St. Louis Fed’s Financial Stress Index
- Market Psych Offers Language-Based Fear Index
- Three Fear Indicators (or…The Three Baritones)
- VIX Showing Signs of Progressive Desensitization
- Availability Bias and Disaster Imprinting
- Chart of the Week: Record Low Yields for the 2-Year U.S. Treasury Note
- Chart of the Week: 10-Year Treasury Note Yield
- Chart of the Week: Ratio of VIX to Yield on 3 Month T-Bills
- The Credit Default Swap Canary
- A Sentiment Primer (Long)
- Trading Resources: Print and Electronic Magazines

[source(s): Federal Reserve Bank of St. Louis]
Disclosure(s): none

