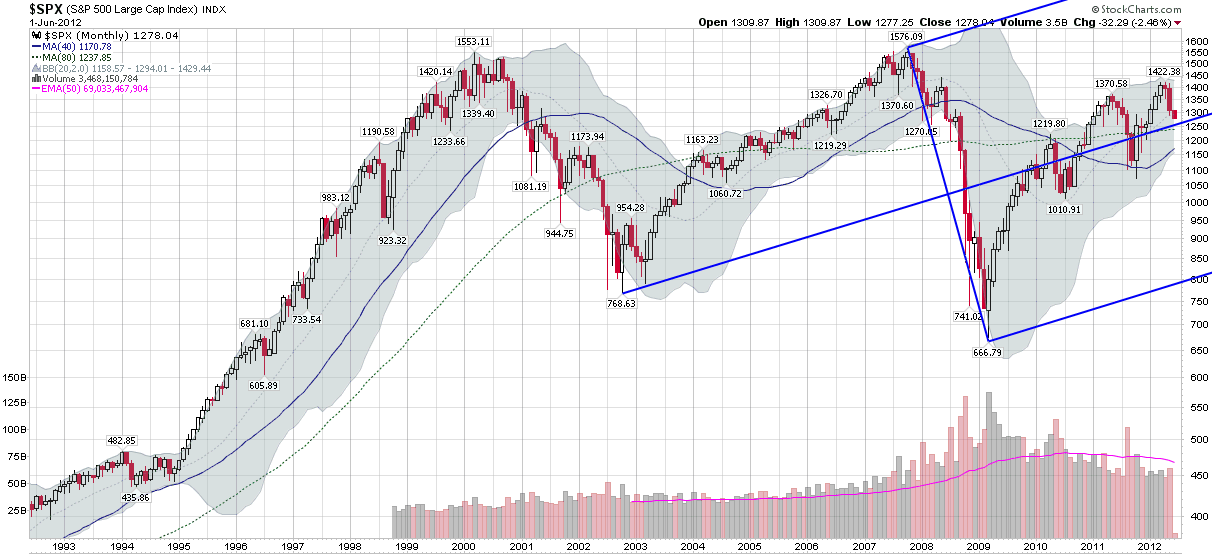
Chart of the Week: SPX Andrews Pitchfork
With phrases like “inflection point” and “fiscal cliff” ricocheting around in their heads over the weekend, investors had quite a few extreme scenarios in mind for equities today, but for the most part, hovering around the unchanged line was not considered a likely outcome. Yet, 1 ½ hours into today’s session, stocks are essentially flat.
I mention all this because if one looks at a monthly Andrews Pitchfork chart for the last two decades, the moves in stocks over the last 2 ½ years or so look remarkably unremarkable, with stocks hugging the middle prong of the pitchfork, which currently points at a trend line “fair value” for the SPX of about 1265.
Part of the reason I am posting the chart below is that it shows a surprising degree of moderation and mean reversion in recent stock moves. The other reason I have attempted to shoehorn Andrews Pitchforks into the discussion is that the last two times I posted about these charts, I have received very strong reader feedback that suggests those who are seeing these charts for the first time are attracted to the visual simplicity and underlying logic of these charts. Going forward, this Andrews Pitchfork chart will provide some real value if it can help to define a channel and mean reversion target for stocks. With all the macroeconomic uncertainty out there, it would be nice if something in the technical toolbox can provide investors with some meaningful context that incorporates elements of both volatility and direction.
For more on Andrews Pitchfork charts, check out the two links below.
Related posts:

[source(s): StockCharts.com]
Disclosure(s): none

