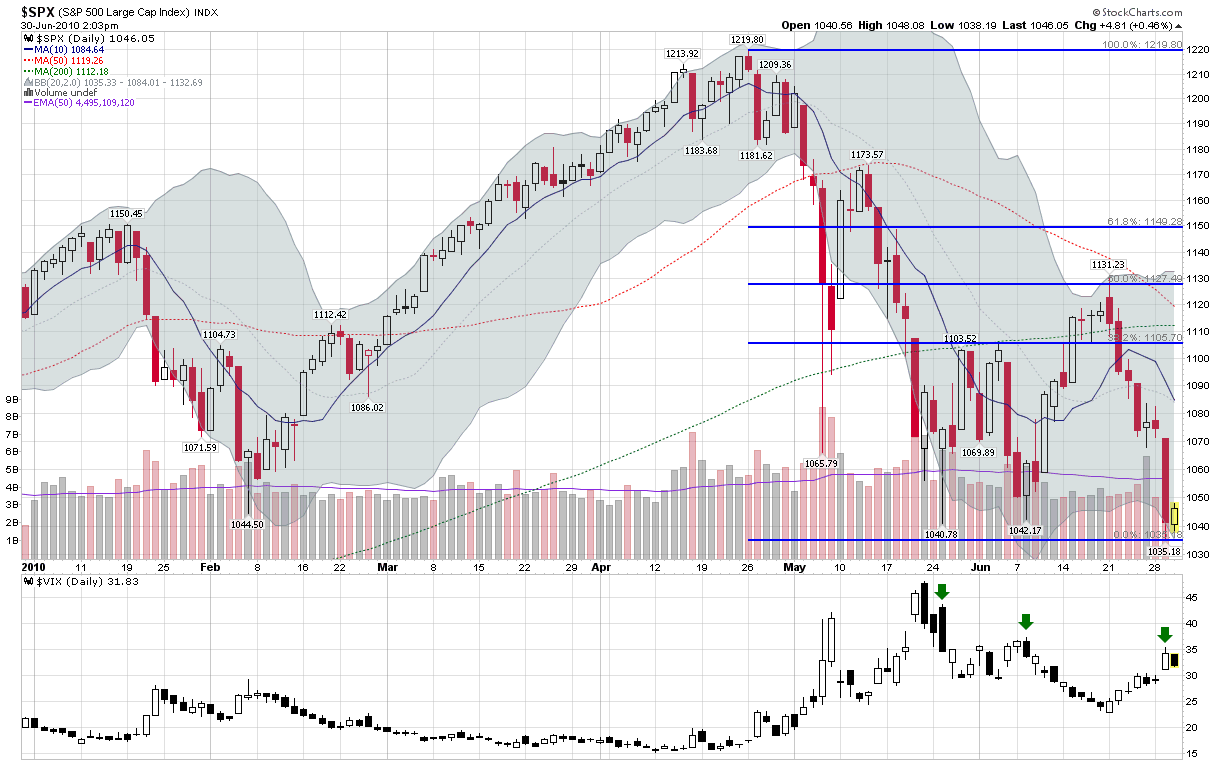
VIX Showing Signs of Progressive Desensitization
Since hitting a high of 1219 April, the S&P 500 index has fallen below 1045 on three separate occasions, most notably during yesterday’s session, when the SPX dropped all the way down to 1035.
Interestingly, each successive time the SPX has dropped below 1045, the corresponding VIX spike has topped out at a lower level, as highlighted by the green arrows. Back on May 25th, when the SPX fell as low as 1040, the VIX spiked as high as 43.73. When the SPX fell to 1042 on June 8th, the VIX only made as high as 37.38. Yesterday, when the SPX fell below a critical support level at 1040 and went as low as 1035, the VIX was only able to muster a spike to 35.39.
The increasing sluggishness in the VIX reflects what I call a progressive desensitization to fundamental factors (e.g., the European sovereign debt crisis, a potential double dip in housing, etc.) and technical factors (the breaching of support at SPX 1040) that investors experience after the novelty of various threats – including very serious ones – begins to wear off.
In fact, it is common for the VIX to be less responsive to subsequent breakdowns in stocks. This is a subject I discussed at some length in VIX Spikes and the 2002 Market Bottom and again on March 6, 2009 (what timing!) in Markets Continue to Fall, VIX Relatively Flat. The pattern of a progressive desensitization in the VIX is fairly common and can be seen once again in the chart below.
Note that in terms of implications, this means that once investors have become somewhat accustomed to a declining market, it will be more problematic to rely on the VIX spiking to a new high as a signal for a market bottom.
For more on related subjects, readers are encouraged to check out:
- VIX Spikes and the 2002 Market Bottom
- Markets Continue to Fall, VIX Relatively Flat
- The Significance of Double Tops in the VIX

[source: StockCharts.com]
Disclosure(s): short VIX at time of writing

