Showing posts with label market bottoms. Show all posts

Thursday, August 4, 2011

VIX Over 31 and SPX Down 12.5% From Peak as Bottom Nears

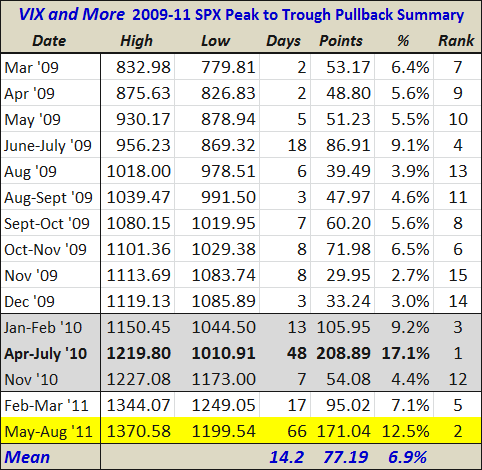
Calling bottoms in the stock market is part art and part science, but with the VIX closing over 31 today (up 35.4% to a close of 31.66) and the S&P 500 index having fallen 12.5% peak to trough from its early May high, the markets are likely nearing a bottom. Given that the SPX closed right at 1200, just above the intraday low, it is unreasonable to expect that a bottom is already in the books, but with today’s plunge, the process of finding a bottom has already begun.

Sure the problems with the European sovereign debt crisis seem to be at least one step ahead of the European Central Bank and there are widespread signs that economic growth is slowing across the globe, but a number of market sentiment indicators and technical factors suggest that the selloff in the past week has been overdone and way too emotional, perhaps with a healthy dose of forced selling in the mix. For some perspective, ask yourself just how bad tomorrow’s jobs number will have to be to prevent at least a relief rally from starting tomorrow.

As the table of SPX pullbacks below illustrates, the current selloff is the second sharpest in terms of magnitude since the bull market began in March 2009. It is now the longest in terms of duration, spanning 66 trading days since the high of SPX 1370.

Those who want to initiate new long positions in this environment may wish to limit risk by using options (long calls, bull call spreads, bull put spreads, etc.), but the time has come for the contrarian in the asbestos suit to start at least nibbling on the long side. Those with a more cautious demeanor may prefer to wait for some better evidence of a technical bottom and perhaps even a confirmation of that bottom, but while buying at current prices may risk being a little early, there is also a good chance that today’s sale prices will not be around for long.


[On a personal note, this blog has been quiet for a while as family matters, a vacation and three new computers have competed for my attention. With volatility back on the front page, I will be posting again on a daily basis (at least) in order to offer my perspective on the current spike in volatility, some of its causes and the implications for trading.]

Disclosure(s): none

Wednesday, June 30, 2010

VIX Showing Signs of Progressive Desensitization

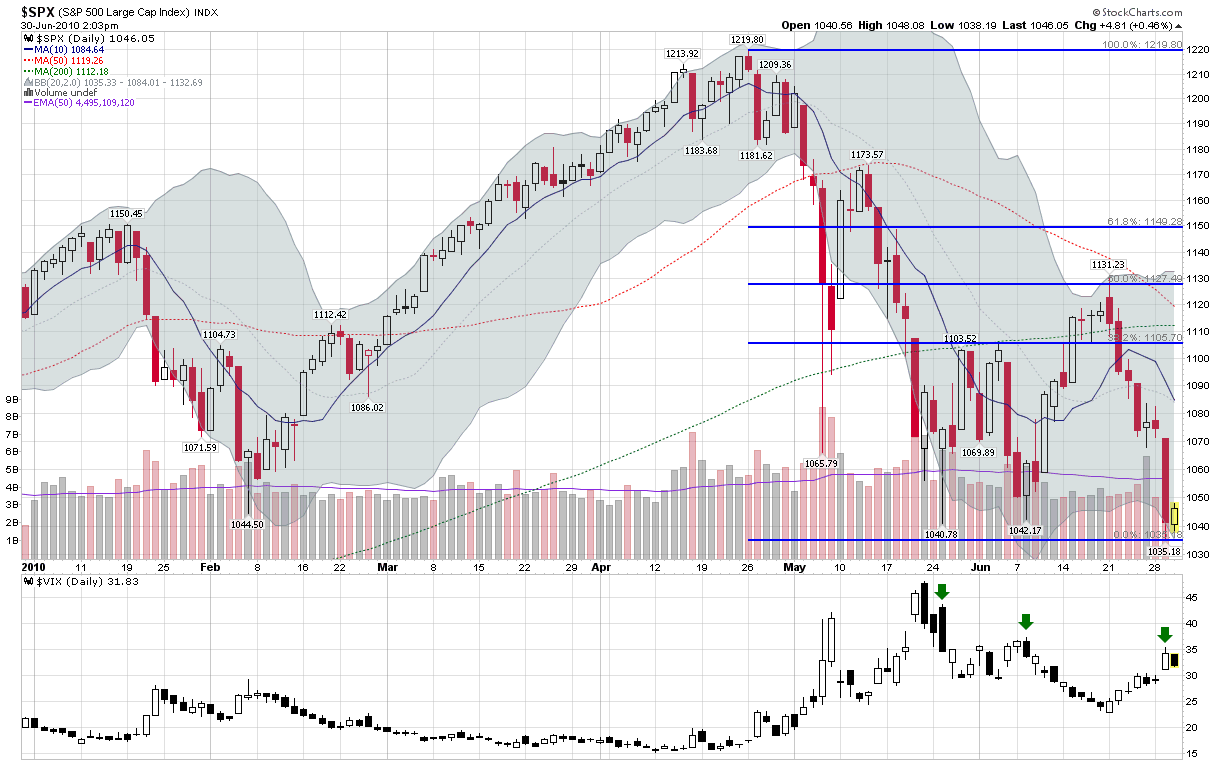
Since hitting a high of 1219 April, the S&P 500 index has fallen below 1045 on three separate occasions, most notably during yesterday’s session, when the SPX dropped all the way down to 1035.

Interestingly, each successive time the SPX has dropped below 1045, the corresponding VIX spike has topped out at a lower level, as highlighted by the green arrows. Back on May 25th, when the SPX fell as low as 1040, the VIX spiked as high as 43.73. When the SPX fell to 1042 on June 8th, the VIX only made as high as 37.38. Yesterday, when the SPX fell below a critical support level at 1040 and went as low as 1035, the VIX was only able to muster a spike to 35.39.

The increasing sluggishness in the VIX reflects what I call a progressive desensitization to fundamental factors (e.g., the European sovereign debt crisis, a potential double dip in housing, etc.) and technical factors (the breaching of support at SPX 1040) that investors experience after the novelty of various threats – including very serious ones – begins to wear off.

In fact, it is common for the VIX to be less responsive to subsequent breakdowns in stocks. This is a subject I discussed at some length in VIX Spikes and the 2002 Market Bottom and again on March 6, 2009 (what timing!) in Markets Continue to Fall, VIX Relatively Flat. The pattern of a progressive desensitization in the VIX is fairly common and can be seen once again in the chart below.

Note that in terms of implications, this means that once investors have become somewhat accustomed to a declining market, it will be more problematic to rely on the VIX spiking to a new high as a signal for a market bottom.

For more on related subjects, readers are encouraged to check out:


[source: StockCharts.com]

Disclosure(s): short VIX at time of writing

Monday, March 9, 2009

Easy vs. Hard Bottoms

Today the major market indices have been fluctuating on both sides of Friday’s close, occasionally flirting with a short-covering rally only to make a hasty retreat and begin what looks like the beginnings of another bull whipping.

Last Thursday I stuck my neck out and said, “with the SPX at 687 as I type this, we are very close to an intermediate-term bottom.” Frankly, I envisioned a more impressive bounce than the current situation, which still has the SPX treading water at 687. A question that is worth pondering, however, is what type of bottom is most likely to stick. Sure, a 300 point jump in the DJIA is likely to attract some additional money on the long side, but it is also likely to further embolden many of the shorts. In the current market environment, I would call that type of V-shaped bottom an “easy bottom” and suggest that the shorts are not likely to let the current bear buffet end with one sharp move. The easy bottom is more likely to be yet another bull trap.

Compare an easy bottom with a hard-fought one. Instead of the 300 point jump that brings the markets more than a white knuckle distance away from the edge of a cliff, imagine a market in which every point becomes a matter of trench warfare, with some territory changing hands dozens of times between bulls and bears before bulls can finally lay claim to infinitesimal victories. These will be largely moral victories at first, but over the course of time as a war of attrition develops, many small gains will eventually add up to momentum. Said another way, I do not believe the bears will throw in the towel all at once, but will slowly lose interest as the pickings become slimmer.

So…as much as an SPX back over 700 might seem to give that devilish 666 bottom the best chance of holding, I believe that the hard bottom is more likely to hold than the easy bottom.

Friday, March 6, 2009

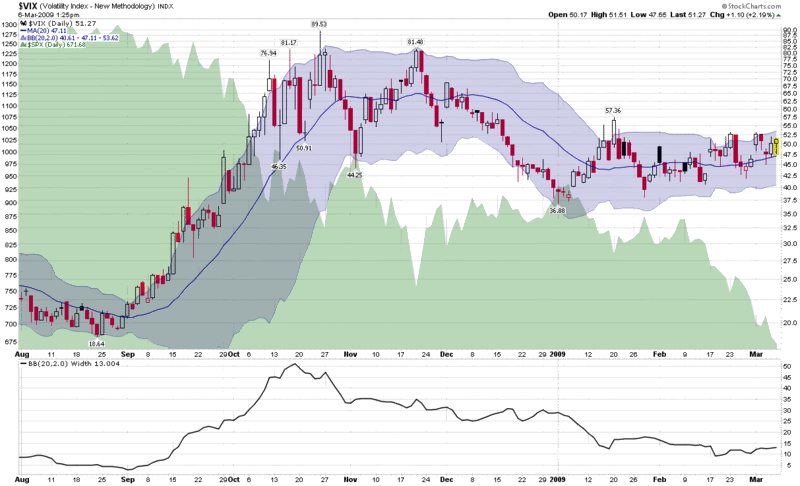
Markets Continue to Fall, VIX Relatively Flat

When it comes to the VIX, lately the question on everyone’s mind is why the VIX has been relatively flat – and considerable lower than it was in October and November – while the markets have been making multi-year lows.

There are a couple of ways to look at this question.

First, consider historical volatility. From a strictly statistical perspective, 20 day historical volatility in the SPX peaked at 85 at the end of October and now sits at about 41, so in terms of actual recent volatility, a VIX of about half of the October-November highs seems consistent with recent market movements.

Of course the VIX reflects implied volatility, not historical volatility and implied volatility incorporates incremental changes in uncertainty and fear on top of recent historical volatility. At least this is an easy way to conceptualize some of the component parts of the VIX. The logical conclusion is that not only is the historical volatility component of the VIX dwindling, but so too are some of the uncertainty and fear aspects.

This is not to say that the current economic environment is lacking in fear and uncertainty. Still, there is a process of habituation and coping that has taken place over the course of the past six months. Michael Kahn, writing in Barron’s on Wednesday, calls this phenomenon Slow-Motion Capitulation, which will eventually lead to an “apathy bottom.” The idea is similar to what I proposed a day earlier as a “stealth bottom.”

While I think all of the above is important, I also think it overlooks the obvious. As I write this the S&P 500 index is 57.4% below its October 2007 high. In October and November, there were concerns that the SPX could fall several hundred points more. Well it has. Now a couple hundred additional points to the down side may still be in the cards, but it will be increasingly difficult for shorts to squeeze money out of already depressed equities. Also, as investors have slowly capitulated over the course of the past year or so, there are fewer and fewer holdouts left to panic – and many of those already have purchased put protection for their remaining long positions.

The chart below shows that death by 1000 cuts will not likely trigger a VIX spike. Regardless of what your directional outlook is for equities, this looks to be a good time to be selling options, particularly using vertical credit spreads.

[source: StockCharts]

Thursday, March 5, 2009

SPX at 687; Intermediate Bottom Potential Is High

This market has been notoriously difficult for calling bottoms, but I think with the SPX at 687 as I type this, we are very close to an intermediate-term bottom.

Tuesday, March 3, 2009

The Possibility of a ‘Stealth Bottom’

The more I hear about the need for some sort of dramatic capitulation to affirm that a bottom has been made, the less likely I think it is going to happen. Instead, my thinking is that the longer and steeper the bear market, the more likely that any sort of capitulation will happen in stages.

Frankly, I find a scenario like the 2002 NASDAQ bottom to be a better template for a bottoming in the current market environment than most of the other possibilities that have been discussed. In VIX Spikes and the 2002 Market Bottom, I noted how the dot com bear market saw five VIX spikes of decreasing magnitude and ultimately found a bottom on a relatively small VIX spike and unremarkable volume. In short, it was a stealth bottom.

I would not at all be surprised to see the current bear market end in a similar stealth bottom. Sometimes a desensitized investment community is more likely to form a bottom than a panicky one.

Thursday, January 15, 2009

Good Chance SPX 821 May Be a Higher Low

It's way to early to know, but the odds are fairly good here for longs

Wednesday, January 7, 2009

Satyam, Fraud, and the India VIX

Today’s announcement that Satyam (SAY), the Indian outsourcing giant, has been engaged in a massive accounting fraud over the course of several years sent Satyam down 78% in local trading and dragged the Bombay Sensex down 7.3%.

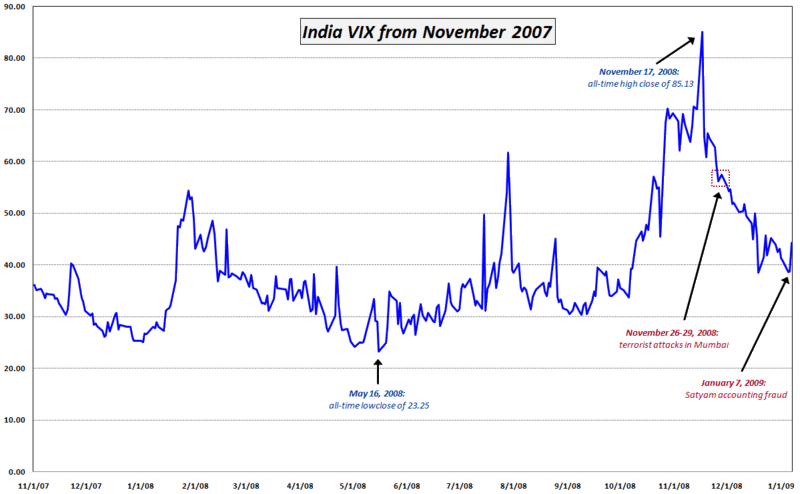
All things considered, I was once again surprised by the relatively small spike in the India VIX, which jumped 14.5% to close at 44.36.

In the chart below I have plotted the course of the India VIX since November 2007 (the index launched in April 2008, but historical data has been reconstructed extending back another six months.) I find it interesting that the scale of the India VIX is not that much different than that of its U.S. counterpart. I also find it interesting that concerns about the global financial crisis in October 2008 was responsible for the peak in the volatility index, while the Mumbai terrorist attacks the following month barely register as a blip on the chart.

It remains to be seen what sort of long-term fallout the Satyam fraud will have on Indian equities, but so far the reaction has to be considered a relatively muted one.

Keep in mind that after many failed attempts at a bottom in 2001 and 2002, the NASDAQ did not put in a bottom until just after the WorldCom bankruptcy filing.


[source: National Stock Exchange of India, VIX and More]

Sunday, December 7, 2008

The Significance of Double Tops in the VIX

The following is adapted from a subscriber newsletter segment that appeared in the November 26th newsletter.

I have never seen any research on the subject of VIX double tops, but given the recent double top formation in the VIX, I thought this might be a good time to share some of my thinking on the subject. First, the chart at the right shows the recent VIX levels from mid-August to the present. The first spike in the double top comes on October 24th and the most recent spike comes on November 19th.
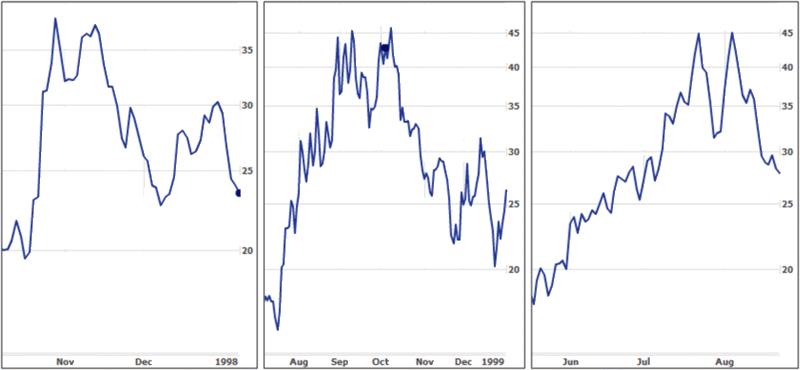
Double tops are fairly common in the 19 year history of VIX data and frequently coincide with extreme readings in the VIX. By contrast, VIX triple tops are relatively rare; and while single VIX spikes are common in more mundane market conditions, they are less likely to be found at VIX extremes than double tops.

In fact, prior to this year, the three crises with the most extreme VIX readings were the 1997 Asian Financial Crisis, the 1998 Long-Term Capital Management Crisis, and the 2002 bottom of the technology bust that accompanied the WorldCom bankruptcy filing. In the graphs below, I have recorded the history of these VIX spikes. You can clearly see a double top pattern in the VIX in all three instances. Interestingly in each instance, the spikes were separated by approximately 2-3 weeks and signaled major turning points in the markets.

Recent events have shown that extrapolating from past chart patterns to the current market is fraught with danger, but I would argue that the presence of a VIX double top reinforces the case that the recent stock market bottom will prove to be an important market inflection point.

[source: Yahoo, VIX and More]

Tuesday, December 2, 2008

Arms Index Extremely Extended

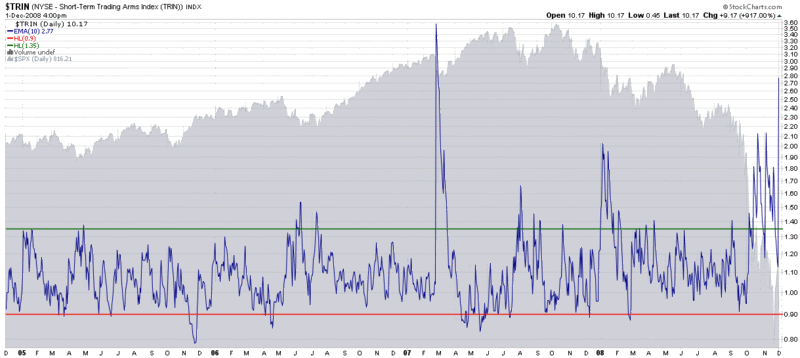
The Arms Index or TRIN is an indicator that I watch closely for short to intermediate-term setups. The indicator which combines ratios of advancing issues to declining issues and advancing volume to declining volume is a reasonably reliable contrary signal.

Since mid-October the Arms Index has been generating a number of historically high signals. In the chart below, I used a 10 day exponential moving average as a smoothing factor. Note that the TRIN’s 10 day EMA appears to have climaxed yesterday in the manner that has historically provided excellent buying opportunities. To my ears, yesterday’s climax in the TRIN is suggesting that the November 21st bottom is likely to hold. Shorts beware…

[source: StockCharts]

Monday, November 24, 2008

Time to Be Long China?

Back on October 10, 2007, in a post with the title When to Short China? I predicted:

Eventually, there will come a time when you will look back and say to yourself, “Why wasn’t I short China? It was such a no-brainer…”

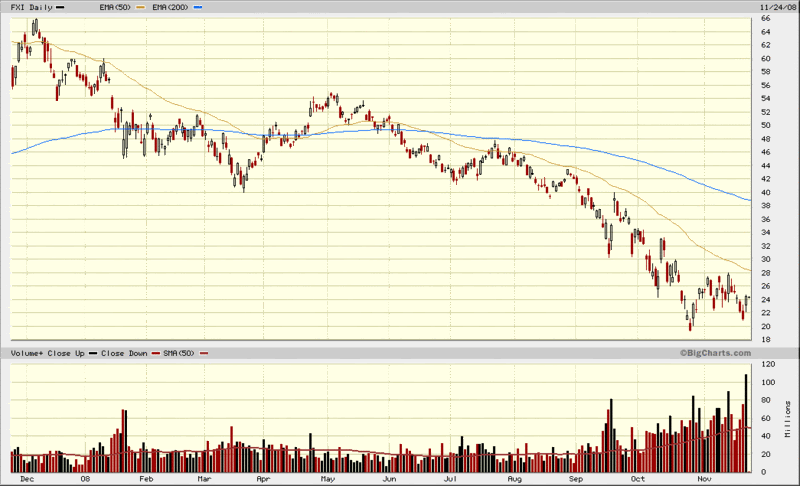
In the 13 ½ months since that post, the iShares FTSE/Xinhua China 25 Index (FXI) has fallen from a split-adjusted 63 to 24 and change, a loss of about 62%.

Now predicting tops and bottoms is always a dangerous parlor game, but investors should always be wary of potentially important tops and bottoms.

Returning to China, notE that in the chart below, last week’s low in the FXI was about 5% higher than the October low, with Friday’s rebound accompanied by record volume. I would not likely confirm a rally in FXI until it closed over 28 or so, but the signs of a bottom look more promising in the FXI than they do in many corners of the U.S. equity markets.

There is considerable disagreement about how much of the $586 billion Chinese stimulus package accounts for new spending and how much references projects that had already been committed to, but were relabeled to fit under the stimulus umbrella. There is also a broad range of opinions around the amount the Chinese economy has slowed, with current estimates pointing to economic growth of 7% at the high end to perhaps the possibility that the Chinese economy might be shrinking. As additional light is shed on these issues, expect the FXI to lurch dramatically up and down. Do not be surprised, however, if the October 27th low of 19.35 turns out to be the bottom.

[source: BigCharts]

Thursday, October 16, 2008

VIX:VXV to 1.51

There is no such thing as a guaranteed bottom, but there is a high probability that we just confirmed a bottom...depending, of course, on the volume of hedge fund liquidations still to come

Monday, September 15, 2008

VIX Spikes and the 2002 Market Bottom

With the VIX spiking over 30 this morning and investors wondering if the markets will ever find a bottom, this seems like a good time to talk about VIX spikes and market bottoms. Specifically, I want to dispel the myth that bear markets have to end in some grand capitulation climax that includes a dramatic volatility spike.

A perfect counter example to the VIX spike requirement can be found in the bear market that followed the NASDAQ boom which crested in March 2000. In fact, with the exception of the current bear market, the 2000-2002 bear market is the only bear market since the launch of the VIX back in 1993 or the historical reconstruction of VIX data by the CBOE that dates back to 1990.

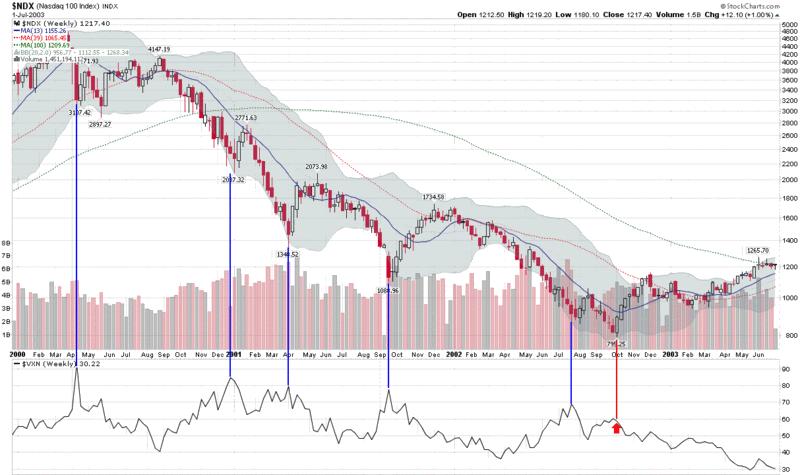
Rather than use the SPX and the VIX to demonstrate my point, the chart below uses the NASDAQ-100 index (NDX) and its companion volatility index, the VXN. The reason I chose the NDX is that from the March 24, 2000 peak (4816.35) to the October 8, 2002 bottom (795.25), the NDX lost an astonishing 83.5% of its value. If there was ever an opportunity to witness a dramatic drop and capitulation, this was the market and index in which to see it happen.

If one looks at a chart of the NDX and the VXN for the period 2000-2002, five distinct VXN spikes stand out. I have highlighted these with a blue vertical line for easy reference in the chart below. It turns out that those who went long at the time of these volatility spikes saw anywhere from two weeks of a bounce to several months of mostly sideways action. None of these spikes signaled a lasting market bottom.

When the NDX finally hit bottom (marked by the red vertical line and arrow), the VXN barely moved at all. Yes, the nastiest bear market of the last two decades ended with a volatility whimper. I like to call this type of bottoming action a "stealth bottom."

Capitulation comes in all shapes in sizes. Most bottoms are marked by a VIX spike. If, however, you assume that volatility spikes will mark the bottoms and bottoms cannot form without a VIX spike, you will be overlooking an important lesson from perhaps the most important recent bear market.

[source: StockCharts, VIX and More]

Wednesday, July 2, 2008

Getting Tougher to Push Financials Lower from Here?

Halfway through today’s session, my screen is once again filled with red, as the indices look as if they are poised to take a run at yesterday’s lows.

From a sector perspective, the picture is considerably muddier, as two recent laggards, financials (XLF) and consumer discretionary (XLY), are clinging to positive territory as I type this. As I see it, one or the other of these sectors will have to continue to deteriorate if the markets are going to continue lower from current levels.

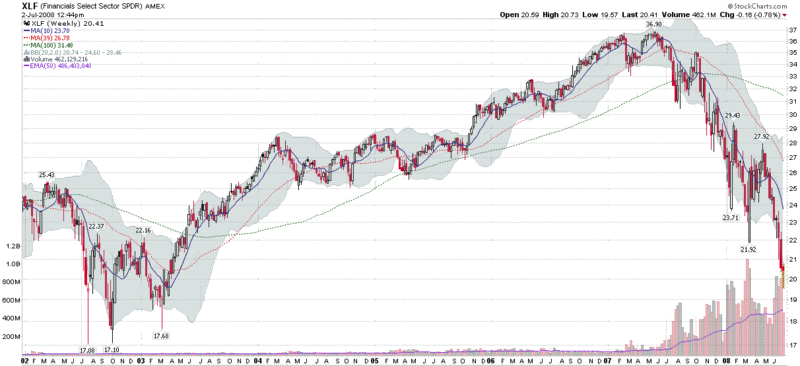
Given that the financials are already down 53% from their May 2007 highs (see chart below), it is important to keep in mind that the easy money has already been made on the short side. A wide variety of financial sub-sectors (mortgage companies, bond insurers, money center banks, regional banks, investment banks/brokers, etc.) have already made multiple trips to the woodshed – and while some individual issues may still be quite vulnerable going forward, there is a limit to the amount of blood that can be squeezed from a broad-based ETF or index.

Going forward, I suspect the risk/return profile of the financial sector may actually favor the bulls. If the next couple of broad market moves down fail to pull the financials with them, the path of least resistance for the likes of XLF may indeed be up. Keep an eye on this development, because if (and admittedly this is a very large “if”) the financials are done falling, then the markets are likely to be ready to put in a bottom too.

Thursday, April 10, 2008

Persistent High Put to Call Ratio

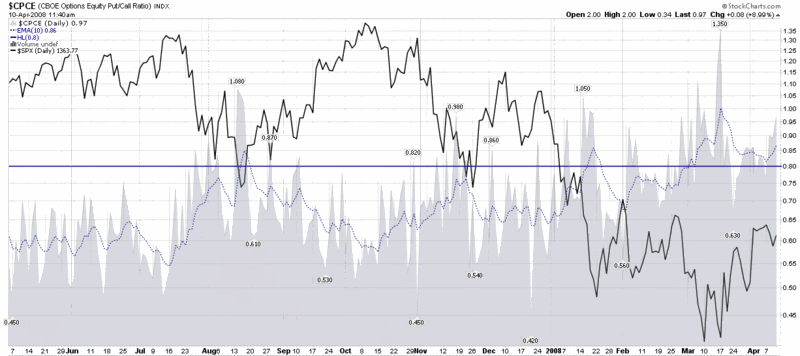
The last time I mentioned the CBOE Equity Put to Call Ratio, one month ago today, it was at such elevated levels that I titled the post Put to Call Everest and limited my commentary to a brief question, “What number comes after infinity?” The extreme put to call data even inspired me to make my first major bottom call since trying to catch the bottom in the NASDAQ in 2002 (I was also a little early then, but close enough.)

Fast forward one month and the put to call data continue to show a preponderance of non-believers, with put buying dominating the options activity. Given the headlines of the past few days, this widespread pessimism is easy to understand. The more important question is how long it will endure.

Critical market bottoms are almost always marked by a spike in put to call ratios. For aggressive investors, the current levels probably offer an attractive risk-reward profile. More conservative investors may wish to wait for a confirmation signal, such as the 10 day exponential moving average of the CBOE Equity Put to Call Ratio dropping below 0.80 (the blue horizontal line in the chart below.) More market shocks certainly lie ahead, but history suggests that the current environment has a high probability of producing above average returns – perhaps even considerably higher than that – over the next month or two.

Wednesday, February 13, 2008

NASDAQ 2315-2320

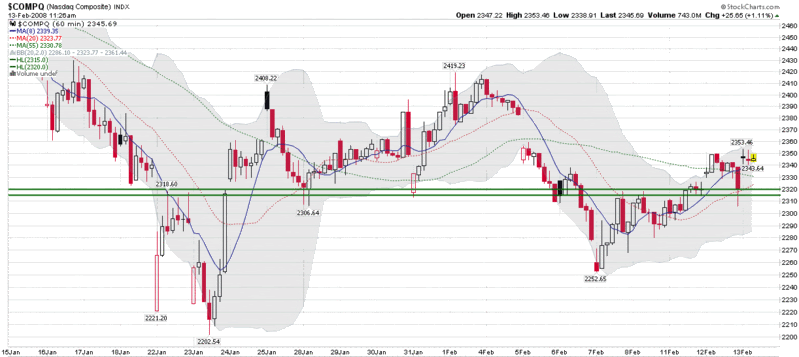
If you have been watching the NASDAQ Composite Index for the last few weeks, it is likely that you have paid close attention the area around 2315-2320.

I usually don’t talk about basic support and resistance levels in the major indices, largely because guys like TraderMike and a host of others cover those bases nicely. Given all the interest associated with whether the market has bottomed or will bottom soon, I chose to focus on 2320 in The Game Is Afoot back on January 25th. With three weeks of hindsight, this has turned out to be an even more critical level than I had expected it would be.

In the chart below, which shows 60 minute bars over the course of the past month, the 2315-2320 area has defined two important gaps and repeated instances of critical support and resistance. If today’s rally continues, it is possible that this level will not be tested going forward; however, if it does get tested again, expect the battle for 2315 to be one of the most important skirmishes that will determine whether the lows of January 22nd and 23rd turn out to be a bottom.

Friday, February 1, 2008

What Fell and What’s Bouncing

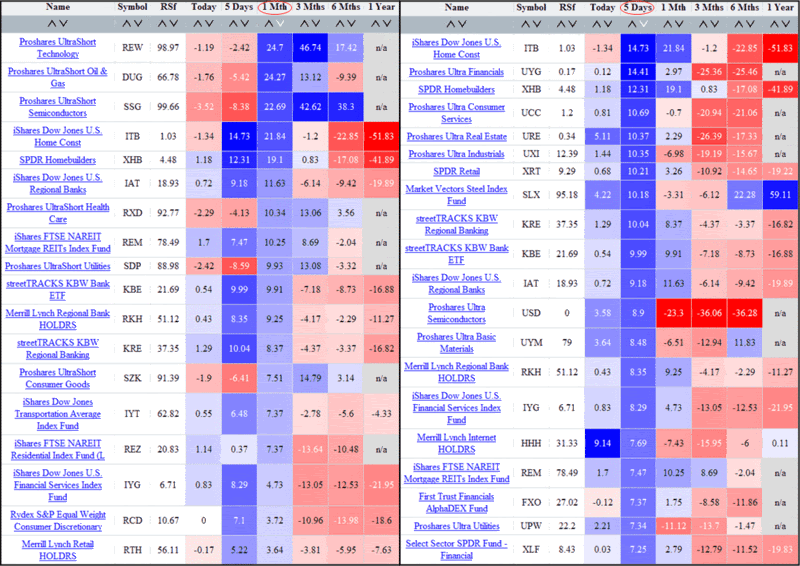
The chart below shows two different performance sorts of sector ETFs. On the left are the top ETF sector performers during the past month; on the right are the top ETF sector performers during the past five days. For the record, these graphics were generated by ETFScreen.com and can be sorted by any time frame specified in the columns.

Not surprisingly, the big winners for the month were the ultrashort ETFs, particularly in technology and energy sectors. On the long side, real estate and finance-related ETFs showed well during the month, an indication that these sectors may be attracting a fair amount of bottom feeding activity.

Switching to performance data for the last five days, one can clearly see the strong buying action in the real estate and financial sectors, with retail and basic materials ETFs also supporting the recent bounce. So far, the bullish action following last week’s bottom has been driven largely by sectors sensitive to interest rates and cyclical growth. The technology sector, which had a nice bounce pre-FOMC, has been largely absent from the party during the past few days.

Thursday, January 31, 2008

Bulkowski on Bottoms

I was surprised to see that while I am in my second year of blogging, I have yet to make a reference to Thomas Bulkowski’s excellent Encyclopedia of Chart Patterns. As the title suggests, this is more of a reference book than a page turner, yet it is an invaluable tool for anyone who is interested in stock charts, whether they would classify themselves as a novice or an expert.

I mention Bulkowski because many people will undoubtedly be trying to determine whether the recent lows are likely to result in a bottom, and what to expect going forward if this bottom holds or if it fails. Bulkowski’s work is an excellent place to start, where you can brush up on a wide range of bottoms he has classified and analyzed from a trading perspective, including the classic Head-and-Shoulders Bottoms, as well as some of the more esoteric Bulkowski favorites, such as Horn Bottoms, Pipe Bottoms, Bump-and-Run Reversal Bottoms, and a variety of double bottom chart patterns.

Whether you agree with all of Bulkowski’s conclusions is not important. Just looking at his work and thinking about how one might go about challenging some of his thinking will more than compensate most traders for the expense of the book. In the end, I find that there is a fair amount that can be swallowed whole and I cannot help but marvel at the meticulous rigor of Bulkowski’s approach, a process that hearkens back to my discussion earlier this week about what makes an expert trader.

In addition to the three books he has written (a fourth, Encyclopedia of Candlestick Charts is due out in the first week of March), Bulkowski maintains a web site, The Pattern Site, that offers a high level view of his thinking, at no charge.

Finally, regarding my own perspective on the recent market action, I am not ready to call a bottom, but the events of the last 48 hours have me thinking that the likelihood we are forming a bottom is much higher than most pundits think.

Friday, January 25, 2008

The Game Is Afoot

Today’s bearish reversal is the first minor skirmish following the recent selloff and attempt at a bottom.
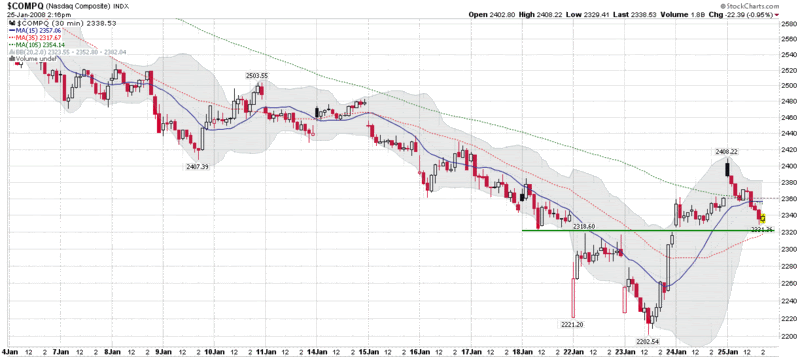
In looking at a chart of NASDAQ composite, the obvious ultimate support level is the 2202 bottom that was put in on Wednesday. Almost as important, however, is the green line at about 2320-2325 that I have added to the 30 minute chart below. For the moment at least, 2320 is the critical line in the sand. This line highlights important gaps on Wednesday and Thursday that served as resistance on both days, as the bottom was forming. Now the 2320-2325 area appears to have flipped from resistance to support in the face of today’s downturn.

It is way too early to draw any conclusions about the bottom earlier in the week, but there is a possibility that we are seeing the first higher low, which would move the battlefield to the 2220-2410 arena – the full extent of today’s range. About the only thing I can say with confidence at this point is that the game is afoot. How well the bulls defend 2320 should go a long way to determining whether this week’s action will turn out to be an important bottom. If 2320 falls, I suspect it will be very difficult to rally sufficient support to make 2202 hold.

Wednesday, January 23, 2008

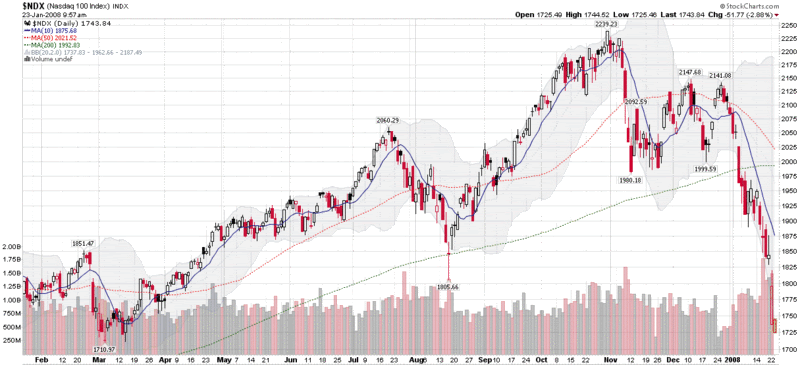
NDX Fails Briefly, Other Indices Hold Bottoms

Bottoms are an interesting species. They are almost impossible to call in advance and surprisingly difficult to identify with a little hindsight. Typically, by the time you have enough hindsight to say, “Hey that was a bottom back there!” you have already missed a good portion of the move up from that point.

A number of indicators can help raise the probability of calling a bottom, the VIX among them, but we are still in the meteorological realm in terms of accuracy – and very much in the pre-Doppler era at that.

Most students of market bottoms agree that evidence of widespread capitulation is the best way to identify a market bottom. The reasoning is essentially that it is ‘better’ to have one day of extreme investor panic than a number of days in which the cumulative losses add up to one big drop while the psyche of the investor is able to digest the grief on the installment.

According to the reasoning above, yesterday had some elements of extreme investor panic at the open, but the ease with which the markets rallied from that point suggest that there may not have been enough panic or pain to account for a traditional capitulation bottom. This morning’s open was also relatively low in terms of panic and pain – at least on the capitulation scale – so there will be many who will wait for another strong retest of yesterday’s lows (and of investor fortitude) before committing to new bullish positions.

It is worth noting that one major index had yesterday’s low breached this morning: the NASDAQ-100 (NDX). Thanks to AAPL’s weak guidance yesterday after the bell, the stock opened dramatically lower and pulled the NDX down with it. The NDX has since recovered, but it and AAPL should be watched closely, as their support levels will likely be tested before those of the other more widely followed indices.

DISCLAIMER: "VIX®" is a trademark of Chicago Board Options Exchange, Incorporated. Chicago Board Options Exchange, Incorporated is not affiliated with this website or this website's owner's or operators. CBOE assumes no responsibility for the accuracy or completeness or any other aspect of any content posted on this website by its operator or any third party. All content on this site is provided for informational and entertainment purposes only and is not intended as advice to buy or sell any securities. Stocks are difficult to trade; options are even harder. When it comes to VIX derivatives, don't fall into the trap of thinking that just because you can ride a horse, you can ride an alligator. Please do your own homework and accept full responsibility for any investment decisions you make. No content on this site can be used for commercial purposes without the prior written permission of the author. Copyright © 2007-2023 Bill Luby. All rights reserved.
 
Web Analytics