Showing posts with label capitulation. Show all posts

Tuesday, March 3, 2009

The Possibility of a ‘Stealth Bottom’

The more I hear about the need for some sort of dramatic capitulation to affirm that a bottom has been made, the less likely I think it is going to happen. Instead, my thinking is that the longer and steeper the bear market, the more likely that any sort of capitulation will happen in stages.

Frankly, I find a scenario like the 2002 NASDAQ bottom to be a better template for a bottoming in the current market environment than most of the other possibilities that have been discussed. In VIX Spikes and the 2002 Market Bottom, I noted how the dot com bear market saw five VIX spikes of decreasing magnitude and ultimately found a bottom on a relatively small VIX spike and unremarkable volume. In short, it was a stealth bottom.

I would not at all be surprised to see the current bear market end in a similar stealth bottom. Sometimes a desensitized investment community is more likely to form a bottom than a panicky one.
Friday, October 10, 2008

VIX to 70.56 as Markets Start to Snap Back

How long this snap back will last remains to be seen, but there is a strong possibility that we just made an intermediate bottom

Thursday, October 9, 2008

Feels Like Capitulation to Me

Not that it cannot get worse, just the I think we stop here for now...

VIX Hits 60

No sign of capitulation yet...

Capitulation Leg?

The sharp move down just after 3:00 p.m. EDT has some elements of a capitulation move.

Wednesday, July 16, 2008

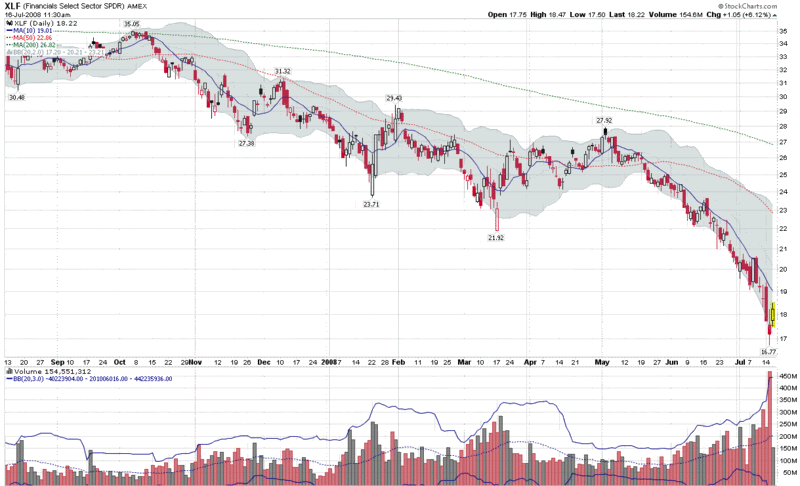
XLF Volume Spikes 3.3 Standard Deviations Above Mean Yesterday

If I could pick only one ticker to watch in order to gauge the market’s health in the current environment, it would probably be XLF, the most popular of the financial sector ETFs. You could make an argument for RKH, the regional bank ETF, XBD, the broker dealer ETF, or any number of others, but XLF covers the entire financial sector, from Allstate (ALL) to Zions Bancorp (ZION).

With all the talk about the degree of a VIX spike needed to signal a bottom and other measures of capitulation, I am surprised I have not heard anyone else mention the volume in XLF yesterday. As shown in the graphic below, XLF traded over 469 million shares yesterday, eclipsing the previous volume record (set just last Friday), by over 150 million shares. The 469 million share turnover also represents 3.3 standard deviations above the mean, which translates into an extremely unlikely event. [Note that in the chart below, the Bollinger band settings for volume are for 3 standard deviations instead of the default 2 setting] This is capitulation-level volume in the sector that is most important to the stock market at the moment. If XLF can weather all the financial sector earnings due out tomorrow, I suspect that a bottom will be in for the financial sector.

Tuesday, July 15, 2008

Bernanke and Moody's May Have Accelerated Formation of Bottom

As I type this, the Dow Jones Industrial Average is down about 200 and the VIX has spiked to 30.79, largely as a result of prepared remarks by Ben Bernanke and a downgrade by Moody's of Fannie Mae (FNM) and Freddie Mac (FRE).

As a result of these two developments, some capitulation activity has been accelerated and the likelihood of an intermediate bottom forming today, tomorrow or Thursday is now over 95%.

Monday, April 14, 2008

Three Top Bloggers Look at the VIX

Since what little ‘analysis’ there is of the VIX is usually of the quick and dirty variety, I was delighted to see that three bloggers who I have a great deal of respect for just happen to be featuring articles on the VIX this morning.

The first piece, from Condor Options, asks a basic question that I often grapple with when it comes to volatility indices: Is the VIX Impervious to Technical Analysis. I have to say that I am largely in agreement on the three main points made in the post:
  • Support and resistance don’t matter
  • Long term moving averages don’t matter
  • Correlation does not imply causation
That being said, in my opinion there are quite a few ways in which technical analysis can be applied to the VIX, but the universe of valid approach is much smaller for the VIX than it is for other indices. Part of the problem, as I have stated here on several occasions, due in part arises from the fact that in the case of the VIX, one cannot trade the underlying directly.

Ian Woodward is clearly of the camp that one can apply technical analysis tools to the VIX. In Whither Goes the Volatility Index – VIX, Ian lays out a detailed TA approach for looking at the VIX and interprets the implications for the markets based on various trading ranges for the VIX this week. I think there is some validity to Ian’s approach, but this is not how I generally use the VIX.

Last but not least, Tom Drake has an indicator that he calls the 2CS, which combines the VXO (the original VIX, prior to the 2003 modifications) and the CBOE combined put to call ratio to get a two dimensional view of options sentiment. In The 2CS Revisited, Tom discusses how he uses the 2CS to help identify market bottoms. His approach appears to be similar to mine in many respects. Also, the 2CS is clearly a relative of the OSI (Options Sentiment Indicator) that I publish and discuss in my subscriber newsletter.

I suspect the increased interest in the VIX is a by-product of the ongoing discussion in many circles that the VIX has not spiked enough to signal a textbook capitulation bottom, particularly given the magnitude of the macroeconomic concerns. I continue to think that while a VIX spike of 40 or more would placate many of those who are waiting for a more obvious sign of capitulation, this is not necessary to confirm a bottom, particularly given the current trading range of the VIX in the low to mid-20s.

Wednesday, January 23, 2008

NDX Fails Briefly, Other Indices Hold Bottoms

Bottoms are an interesting species. They are almost impossible to call in advance and surprisingly difficult to identify with a little hindsight. Typically, by the time you have enough hindsight to say, “Hey that was a bottom back there!” you have already missed a good portion of the move up from that point.

A number of indicators can help raise the probability of calling a bottom, the VIX among them, but we are still in the meteorological realm in terms of accuracy – and very much in the pre-Doppler era at that.

Most students of market bottoms agree that evidence of widespread capitulation is the best way to identify a market bottom. The reasoning is essentially that it is ‘better’ to have one day of extreme investor panic than a number of days in which the cumulative losses add up to one big drop while the psyche of the investor is able to digest the grief on the installment.

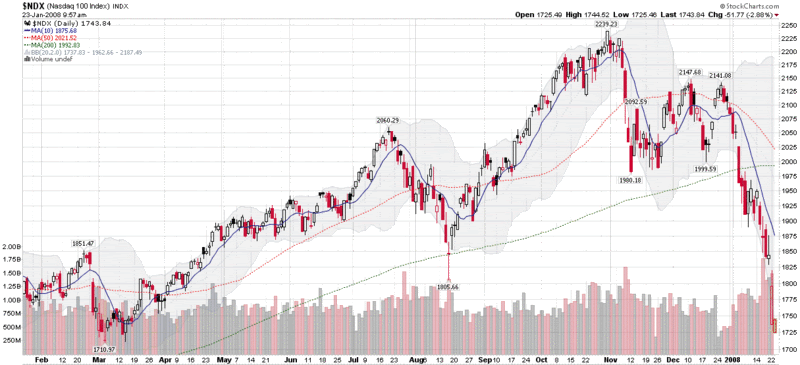
According to the reasoning above, yesterday had some elements of extreme investor panic at the open, but the ease with which the markets rallied from that point suggest that there may not have been enough panic or pain to account for a traditional capitulation bottom. This morning’s open was also relatively low in terms of panic and pain – at least on the capitulation scale – so there will be many who will wait for another strong retest of yesterday’s lows (and of investor fortitude) before committing to new bullish positions.

It is worth noting that one major index had yesterday’s low breached this morning: the NASDAQ-100 (NDX). Thanks to AAPL’s weak guidance yesterday after the bell, the stock opened dramatically lower and pulled the NDX down with it. The NDX has since recovered, but it and AAPL should be watched closely, as their support levels will likely be tested before those of the other more widely followed indices.

Wednesday, February 21, 2007

The Shape of Capitulation in the VIX?

The VIX is a strange animal; and since I just started playing zoologist in this space, I don’t have answers to many of the very basic questions about this beast. Not the least of these questions is whether a chartist approach to the VIX is a valid one. I use charts for everything else, but I have yet to develop a set of charts that I feel has much in the way of predictive value for the volatility indices. I will not, however, let that small detail stop me…

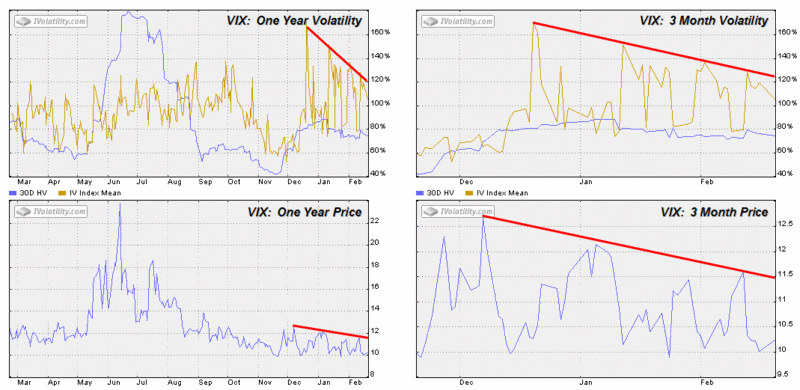
In watching the VIX charts, I have been particularly curious about the mid-December lows and the spike in implied volatility to over 160 that soon followed. As the graphic below shows, when the VIX has dropped and spiked IV, the successive IV spikes have been weaker and weaker.

In fact, both the VIX and the VIX IV seem to have succumbed to some invisible down sloping ceiling over the past two months. If this is true, then the chart wants us to believe that the VIX won’t be going up and it won’t be going down either. For all practical purposes, volatility looks ready to settle in the 10-11 range and it is time for me to change the name of this blog. Of course, at least one VIX watcher was saying essentially the same thing three years ago.

My take is that what we are seeing is likely the shape of capitulation in the VIX. Of course, the VIX is not just a contrary indicator, it is a contrary animal, so much so that capitulation in this case does not print wild swings and large volumes like it does in so many other indicators. No, the capitulation in the VIX is like a glassy pond where this wind has ceased to blow. For now, at least. I wouldn’t furl those sails just yet.

DISCLAIMER: "VIX®" is a trademark of Chicago Board Options Exchange, Incorporated. Chicago Board Options Exchange, Incorporated is not affiliated with this website or this website's owner's or operators. CBOE assumes no responsibility for the accuracy or completeness or any other aspect of any content posted on this website by its operator or any third party. All content on this site is provided for informational and entertainment purposes only and is not intended as advice to buy or sell any securities. Stocks are difficult to trade; options are even harder. When it comes to VIX derivatives, don't fall into the trap of thinking that just because you can ride a horse, you can ride an alligator. Please do your own homework and accept full responsibility for any investment decisions you make. No content on this site can be used for commercial purposes without the prior written permission of the author. Copyright © 2007-2023 Bill Luby. All rights reserved.
 
Web Analytics