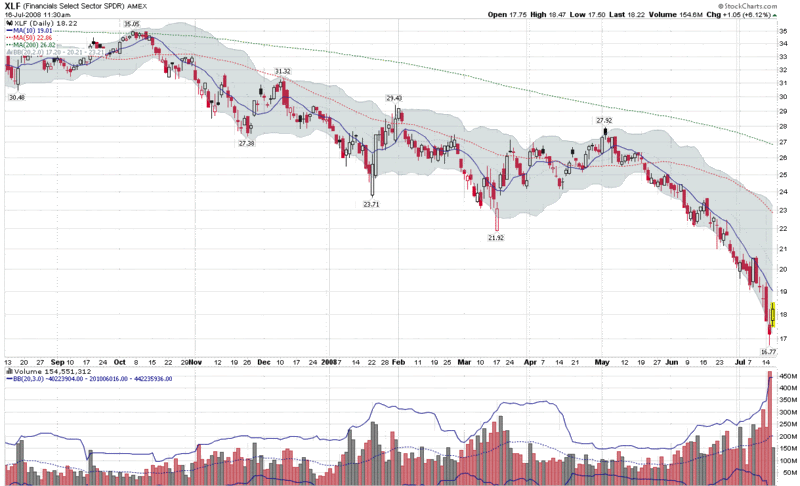
XLF Volume Spikes 3.3 Standard Deviations Above Mean Yesterday
If I could pick only one ticker to watch in order to gauge the market’s health in the current environment, it would probably be XLF, the most popular of the financial sector ETFs. You could make an argument for RKH, the regional bank ETF, XBD, the broker dealer ETF, or any number of others, but XLF covers the entire financial sector, from Allstate (ALL) to Zions Bancorp (ZION).
With all the talk about the degree of a VIX spike needed to signal a bottom and other measures of capitulation, I am surprised I have not heard anyone else mention the volume in XLF yesterday. As shown in the graphic below, XLF traded over 469 million shares yesterday, eclipsing the previous volume record (set just last Friday), by over 150 million shares. The 469 million share turnover also represents 3.3 standard deviations above the mean, which translates into an extremely unlikely event. [Note that in the chart below, the Bollinger band settings for volume are for 3 standard deviations instead of the default 2 setting] This is capitulation-level volume in the sector that is most important to the stock market at the moment. If XLF can weather all the financial sector earnings due out tomorrow, I suspect that a bottom will be in for the financial sector.


7 comments:
Is there a way to measure fear in the financial sector such as a put to all ratio or volatility index?
Hi Jim,
There are a number of ways to look at fear in financials. The implied volatility of XLF is a good place to start. As you mention, put to call ratios for that ETF are an important indicator too. I would also look closely at volume in SKF, which is the double inverse ETF for the financial sector.
I have posted a fair amount on XLF's IV, but perhaps I should post about a more broad-based approach.
Thanks for the question.
Cheers,
-Bill
So funny Bill - I was just talking with people about XLF's volume spike. As they say, there go all the sellers!
Bill, kindly leave your comment in the google finance XLF and V threads about this question: http://finance.google.com/group/google.finance.700196/browse_thread/thread/79c276c397ffe4bb?hl=en#
In both threads I am Thomas Braun
Thank you!
Hi Thomas,
As a matter of policy, I prefer not to get involved in message board threads on Yahoo and Google. That being said, you are free to link to any of my posts or quote some excerpts of what I have said if you believe it helps to support some of the points you are trying to make.
Cheers,
-Bill
From a technical perspective your observation seems reasonable, but I think its the fundamentals that will ultimately drive the financials to a bottom. I fear another "Indymac"-like story is inevitable, and with Fannie/Freddie potentilaly taking up $5T and Indy taking up 10% of the FDIC's reserves... where's the rest of the dough going to come from? Besides, even if the mess we got into so far somehow gets contained, what about all the imminent option-arm, alt a, and prime loan resets that haven't even popped yet and therefore are not even reflected on anyone's books? And, compared to "subprime" this part of the iceberg represents the majority of paper written over last five years. Libor can't stay down forever with all the inflationary pressure. All the beaurocrats are issuing new restrctions that curtail trading and liquidity... three years to late... and everyone passes the same rhetoric about how monetary policy will be loosened, not tighened if ever another depression started loom. Our liquidity is as tight as it gets, and the cash we print will ruin an already devalued dollar. Throw in oil, and Houston, are you seriously thinking we don't have a problem. I am an ignorant fool, but it scares me how plainly obvious a 40-45 vix spike seems likley by aug/sep.
Hey Bill,
Congrats for successfully calling the bottom to the financials.
(Hopefully it is a bottom unless of course there is a CDS explosion on its way).
Post a Comment