Friday, July 11, 2008

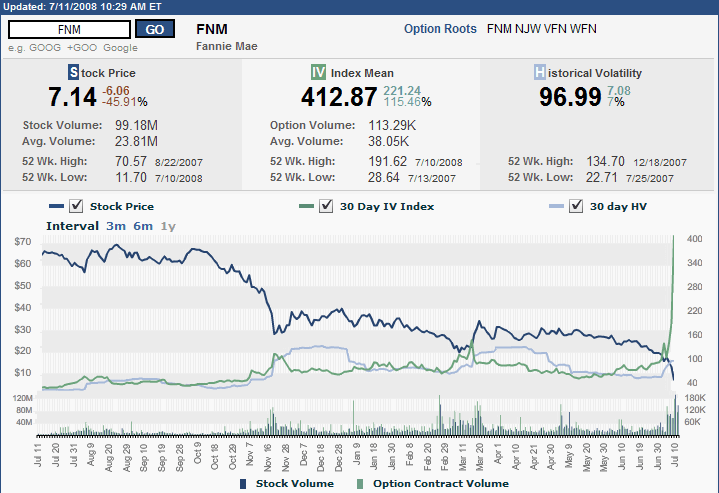
Implied Volatility at Fannie Mae (FNM) Tops 400

Not that this should surprise anyone who has been following this story, but it is an impressive number nonetheless and deserves to be captured here for archival purposes at the very least.
2 comments:

Anonymous said...

Which tool (or website) are you using to generate this kind of chart?

Bill Luby said...

The graphic comes from the ISE web site. Go to their Market Data & Trading Tools tab, then click on Quotes/Volatility.

DISCLAIMER: "VIX®" is a trademark of Chicago Board Options Exchange, Incorporated. Chicago Board Options Exchange, Incorporated is not affiliated with this website or this website's owner's or operators. CBOE assumes no responsibility for the accuracy or completeness or any other aspect of any content posted on this website by its operator or any third party. All content on this site is provided for informational and entertainment purposes only and is not intended as advice to buy or sell any securities. Stocks are difficult to trade; options are even harder. When it comes to VIX derivatives, don't fall into the trap of thinking that just because you can ride a horse, you can ride an alligator. Please do your own homework and accept full responsibility for any investment decisions you make. No content on this site can be used for commercial purposes without the prior written permission of the author. Copyright © 2007-2023 Bill Luby. All rights reserved.
 
Web Analytics