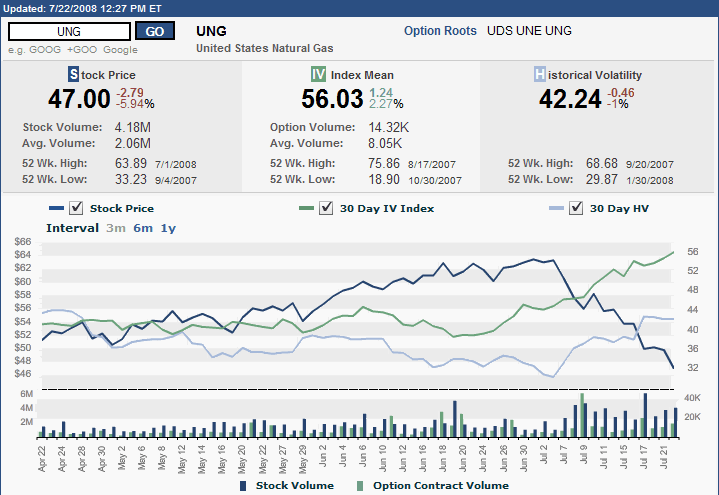
Natural Gas Implied Volatility Spiking
Perhaps it is just a coincidence that the “Oil VIX” appeared on the scene just as the implied volatility in oil futures (or at least as captured by USO) was hitting an eight month high. The “Oil VIX” (formally known as the CBOE Crude Oil Volatility Index; ticker OVX) and crude oil may get the lion’s share of the energy headlines, but lately it has been natural gas that has been making the more dramatic moves.
A look at the three month chart of UNG (the natural gas ETF that is the counterpart to USO), courtesy of the ISE, shows implied volatility steadily increasing over the past five weeks, with the gap between implied volatility and historical volatility continuing to widen – all while natural gas has pulled back about 27%.
Natural gas implied volatility levels are higher than oil implied volatility levels at the moment, and the pullback in natural gas presents some interesting trading opportunities. Some momentum players are already short here and some value hunters are buying on weakness, particularly if they believe in the long-term commodity bull and other supply and demand issues that are specific to natural gas.
The case for natural gas trading sideways from current levels is hard to make. Directional bets are expensive, due to high IV. Two trades I am looking hard at, with a bullish directional bias, are bull put spreads and call backspreads. The former limits upside and downside; the latter is more aggressive and more risky.


4 comments:
I got your post about UNG off of seekingalpha.
What software do you use for options?
Or what was the screenshot from on the seeking alpha article and UNG?
The graphic comes directly from the ISE Quotes/Volatility page.
Regarding software, between thinkorswim, optionsXpress, and iVolatility, I can get about 98% of what I am looking for.
Cheers,
-Bill
Bill
I wanted to possibly get your take on a method that I have used to identify VIX extremes. It is a little different than most.
I like to look for how many higher highs (or lower lows)have been put in since a change in direction in the VIX. Whenever there are 12 or more higher highs, that has been a good time to get ready to go long. This last move up in the VIX put in 16 higher highs since the May low. This is a very high number as most VIX rallies I have found have been 15 or less. So despite the muted rise in the VIX, this seemed to be somewhat of an extreme occurence to me. If you have any insight or backtesting you could do on this, I would find it extremely interesting.
Best of Luck
stockmarketalchemy.blogspot.com
Hi Peter,
Thanks for another thought provoking comment.
I am a big fan of using duration and/or cycle times with the VIX -- in addition to the typical magnitude measurements -- and I think your methodology accomplishes that in an interesting way. I have tested strategies with similarities to the approach you describe, but not the exact methodology.
I will be sure to post the results of future backtesting or ruminations.
Cheers,
-Bill
Post a Comment