Fearogram Maps Recent VIX Complacency
There has been so much talk about complacency in the VIX that I thought I should dust off the old fearogram and see just how complacent the VIX has been as of late.
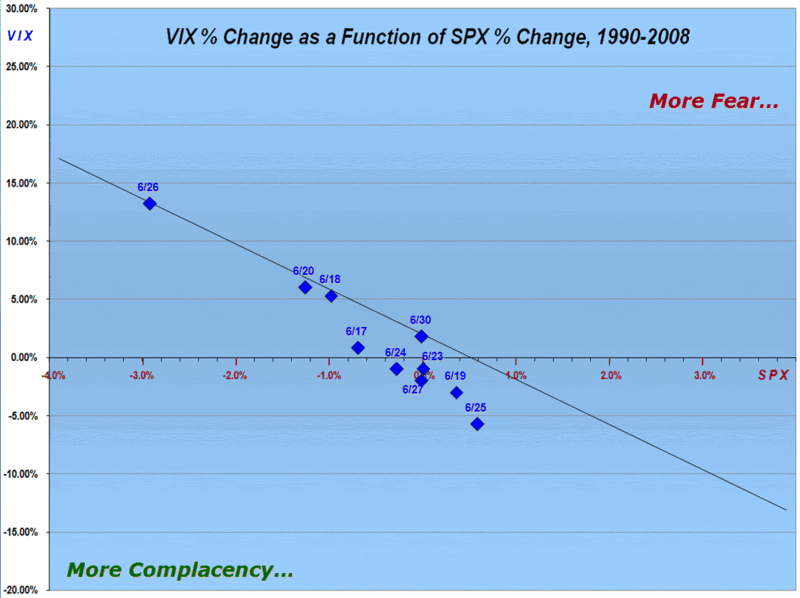
For those who are new to the concept of the fearogram (a term I hatched last October), it is essentially a chart of the daily change in the VIX vs. the daily change in the SPX. (For more background on the fearogram concept, try previous posts with the fearogram label.)
The chart below plots a best fit diagonal black line which represents a ratio of the daily percentage change in the VIX to the daily percentage change in the SPX for every trading day going back to 1990. Essentially, the larger the distance between individual data points and the fearogram best fit line, the more extreme the level of fear or complacency. For data points above and to the right of the best fit line, the VIX is increasing out of proportion to the drop in the SPX, indicating more fear. For data points below and to the left of the best fit line, the relatively muted reaction of the VIX suggests more complacency. Data points that hug the best fit line are indicative of a VIX that is consistent with typical historical relationships between the VIX and the SPX.
In the chart below, the blue diamonds are plots of individual daily ratios of VIX and SPX percentage changes for each day during the past two weeks. In studying the chart, note that during the past two weeks, the VIX has never once shown more fear than is reflected in the average daily ratio.
Of course, today is looking like it could be the day the tide finally turns.


4 comments:
brilliant!
thank you!
Hello,
I will thing that the vix still very low compare to the corection we are having now ....for shure the corection came in a different way then the last 2, Are you not wating for a spike on the VIX befor having any bottom ???
Punky
Hi Punky,
In short, I think a significant VIX spike is more likely than not, but not a requirement for a bottom.
Cheers and good trading,
-Bill
I like your article and it really gives an outstanding idea that is very helpful for all the people on web.
options trading
Post a Comment