Showing posts with label XBD. Show all posts

Wednesday, July 16, 2008

XLF Volume Spikes 3.3 Standard Deviations Above Mean Yesterday

If I could pick only one ticker to watch in order to gauge the market’s health in the current environment, it would probably be XLF, the most popular of the financial sector ETFs. You could make an argument for RKH, the regional bank ETF, XBD, the broker dealer ETF, or any number of others, but XLF covers the entire financial sector, from Allstate (ALL) to Zions Bancorp (ZION).

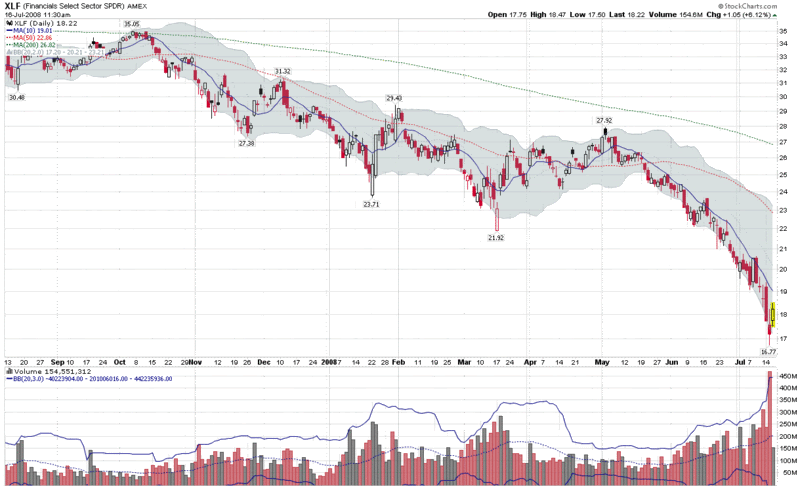
With all the talk about the degree of a VIX spike needed to signal a bottom and other measures of capitulation, I am surprised I have not heard anyone else mention the volume in XLF yesterday. As shown in the graphic below, XLF traded over 469 million shares yesterday, eclipsing the previous volume record (set just last Friday), by over 150 million shares. The 469 million share turnover also represents 3.3 standard deviations above the mean, which translates into an extremely unlikely event. [Note that in the chart below, the Bollinger band settings for volume are for 3 standard deviations instead of the default 2 setting] This is capitulation-level volume in the sector that is most important to the stock market at the moment. If XLF can weather all the financial sector earnings due out tomorrow, I suspect that a bottom will be in for the financial sector.
Tuesday, May 27, 2008

Whither COF?

Ever since the onset of the credit crisis, it seemed like only a matter of time before problems in the area of home mortgages and HELOCs inevitably spread to credit cards. Given that Capital One Financial (COF) has dipped heavily into the subprime borrower market, it seems to reason that COF will be a large part of the collateral damage.

So far, COF has been able to keep charge offs at a manageable rate, one that was stable at 6.1% in March and April. This leveling off of the charge-offs in the most recent month prompted Goldman Sachs analyst Brian Foran to offer optimistically, “any sign that credit deterioration in U.S. card could be taking a breather is positive.”

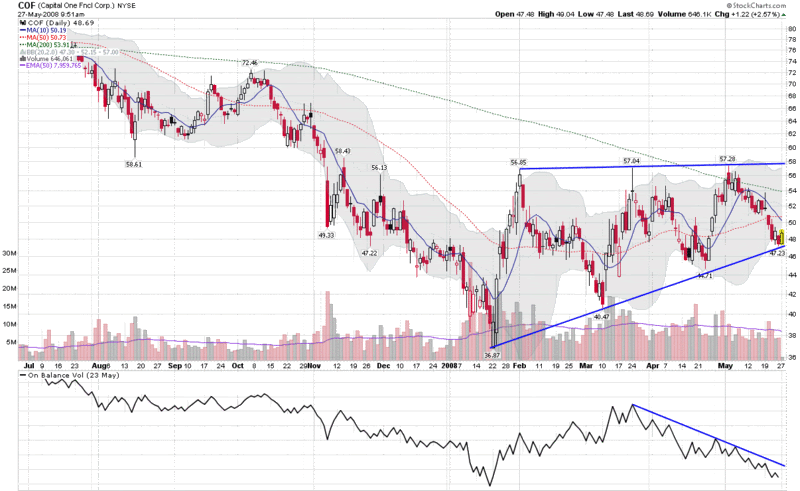
COF’s stock is currently 30% above the January low and has traded in an ascending triangle, as the chart below shows. While the stock is up this morning, it is testing the bottom of the triangle pattern. Ominously, on balance volume shows a significant divergence from the price pattern, with at least three significant distribution days (down on above average volume) over the past four weeks.

While XLF, XBD, C and LEH are all important indicators of the health of the financial sector, keep an eye on COF to see how the credit crisis is affecting subprime credit card holders.

Thursday, December 13, 2007

Implied Volatility as a Sector Drill Down Diagnostic

I have said relatively little about the crisis in the financial sector largely because there are so many others out there who are covering this story in much more detail than I have any desire to get into. Also, my trading is driven largely by technical analysis, charts and market sentiment, with fundamental analysis usually playing a prominent role only in my long-term holdings.

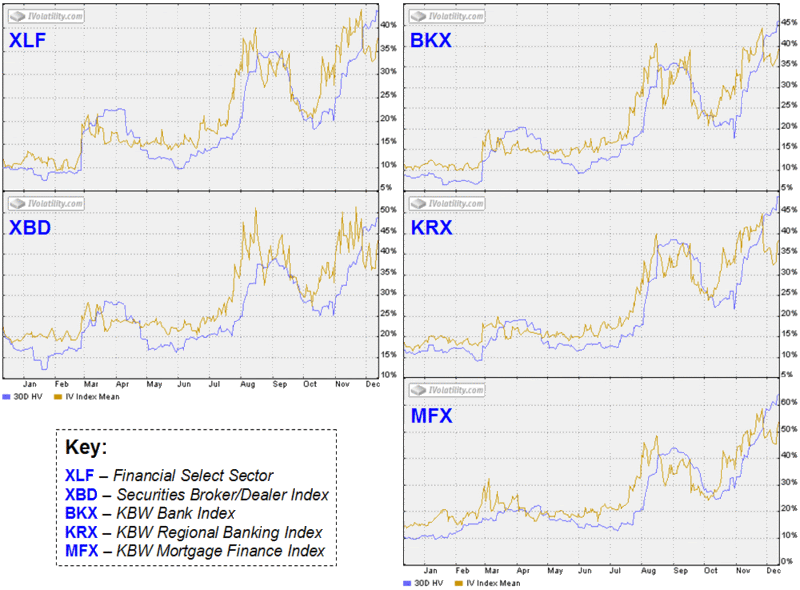
That being said, this blog has an emphasis on volatility and risk, so this morning I pulled up some implied volatility charts in the financial sector and drilled down from general to specific to see to what extent implied volatility might indicate vis-à-vis the possibility of the tide turning in investor fear. I have appended several of these charts below. On the left hand side, they include the generic large cap financial sector index, XLF (components), as well as the securities broker dealer index, XBD, whose volatility I analyzed back in August. On the right side, I have the banks. The BKX (components) is capitization-weighted and thus tilts toward money center banks; the KRX (components) has a strong regional and local focus; and the MFX (components), as the name suggests, includes banks and other financial companies that are heavily involved in the mortgage finance business. For comparison purposes, the BKX is down 18.7% on the year, the KRX is down 20.5% and the MFX is off 44.6%.

From an IV perspective (and yes, many of these companies could use some intravenous fluids) I generally glance at XLF only as a generic overview of the financial sector. The first finding of interest is that implied volatility in the XBD peaked in August and made a double top before Thanksgiving. This is consistent with the widespread belief that Goldman Sachs (GS) has dodged the subprime bullet and other players in this sector have had sufficient time and corporate agility – if not perhaps the ideal risk management policies – to limit any additional damage.

The banks are another story. Implied volatility in the money center banks and regional banks topped out at the end of November and is currently just below the August highs. Still more concerning, if not more surprising, is the performance of the mortgage finance sector, where implied volatility is above the August peak and in the process of challenging the late November high water mark. If I were a meteorologist looking at implied volatility, I would conclude that the storm has passed in the broker-dealer sector, but more thunderclouds are approaching in the regional banking and mortgage finance sectors.

Wednesday, August 29, 2007

Watch XBD’s Implied Volatility

With the DJIA up almost 100 points right out of the gate, I was curious to see GS and BSC quickly fade from green to red – and that weakness reflected in the XBD (Broker/Dealer Index.)

Of course, you probably don’t have to hedge the entire market too catastrophe-proof your portfolio these days. You can probably accomplish the same task by erecting a safety net under just one or two sectors, such as the home builders or financial institutions. So I looked at my favorite bellwether, Goldman Sachs, to see how their implied volatility has fared in the past month or so. While it makes for an interesting visual, I have not included the Goldman chart because the company has a history of slipping punches. A better chart is the XBD, whose components include 12 companies in the broker-dealer space.

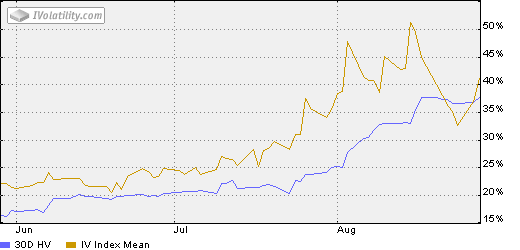
The iVolatility chart below shows implied and historical volatility for the XBD going back three months. Prior to July, the XBD IV spent 95% of the past year in a narrow 20-25 range. After topping 50 in mid-August, the XBD IV looked to be headed back down to 30 or so, until the recent spike left it over 40 yesterday.

While it is important to watch the price level of this index to see how it holds up at support levels such as 215 and 208, I also recommend keeping a weather eye on the XBD’s implied volatility to see what the trend and absolute levels of IV tell us about the thinking of options players. It is quite likely that the tip of the next iceberg may be found floating in the IV chart before it shows up on a price chart.

Friday, August 17, 2007

How Healthy Is the Rally?

I don't have much to add to what has already been said about today's rally.

For what it's worth I am watching three indicators in particular to gauge the health and longer term potential of this rally:
XBD -- broker/dealer index (to a lesser extent XBD:SPX, GS, BSC, BKX, CFC, etc.)
RUT -- Reuters 2000 Small Cap Index (also RUT:SPX)
EEM -- iShares MSCI Emerging Markets (also EEM:EFA)

Right now, all three indicators are outperforming the broad market indices, so I feel as if the rally is on good footing. My biggest concern coming into the day was that would be traders worried about Monday's headline risk, but the longer the indicators noted above continue to do well, the less pressure there will be on the system.

For a little while earlier in the day the markets and the VIX were both up, as fear lingered in the face of a weekend of uncertainty, but for now, the fear component of the VIX seems to be slowly dissipating.

Before I finalize my positions going into the weekend, I will take one last look at Hurricane Dean.

Tuesday, August 14, 2007

Watching the Broker-Dealer Index (XBD) Closely

...to see if the recent 208 low holds.

DISCLAIMER: "VIX®" is a trademark of Chicago Board Options Exchange, Incorporated. Chicago Board Options Exchange, Incorporated is not affiliated with this website or this website's owner's or operators. CBOE assumes no responsibility for the accuracy or completeness or any other aspect of any content posted on this website by its operator or any third party. All content on this site is provided for informational and entertainment purposes only and is not intended as advice to buy or sell any securities. Stocks are difficult to trade; options are even harder. When it comes to VIX derivatives, don't fall into the trap of thinking that just because you can ride a horse, you can ride an alligator. Please do your own homework and accept full responsibility for any investment decisions you make. No content on this site can be used for commercial purposes without the prior written permission of the author. Copyright © 2007-2023 Bill Luby. All rights reserved.
 
Web Analytics